

Bison Bites: Dispatch #11
Data bites touching on: the last 15 years of Final Four efficiency, Indiana's 2024 red zone performance, A-gap success on defense, and comparing Kurtis Rourke to other 2025 QBs.


If you’re new enough to Bite-Sized Bison, you might not be familiar with Bison Bites. Each dispatch of Bison Bites is intended to be a quick-hitting list of approximately 3-5 statistics of interest between typical Bite-Sized Bison posts.
All four Final Four teams in 2025 were in the top-10 in both offensive and defensive efficiency (via KenPom).
If you listen to CrimsonCast, Galen and Scott made a notable observation about this season’s Final Four teams – pointing to the fact that each of them are in the top-10 in both offensive and defensive efficiency, as calculated by KenPom.com.
In the last 15 seasons (since 2010, given that 2020 did not have a Tournament), this is the first time that’s happened, leaving reason to believe that teams are beginning to become more efficient as a means to an end, and, of course, being assisted by the transfer portal and unprecedented player movement.
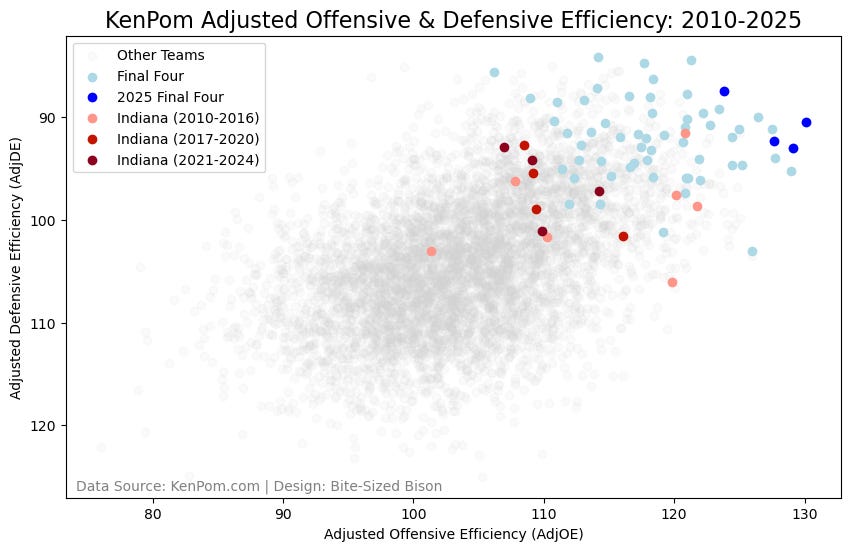
Below is a chart plotting KenPom offensive and defensive efficiency since 2010, with the 2025 Final Four highlighted among Final Four teams and each coaching era (Tom Crean, Archie Miller, and Mike Woodson) delineated as well.
Observations:
Three of the 2025 Final Four teams are a few of the most offensively efficient teams of the last 15 seasons, let alone a few of the most offensively efficient Final Four teams.
Tom Crean led the three most efficient teams of the last 15 seasons at Indiana, including one season (2013) where Indiana’s efficiency numbers signaled a Final Four-capable season. The other two (2012, 2016) had an outside chance. All three ended in the Sweet Sixteen.
There was little variance during the tenures of Mike Woodson and Archie Miller. Indiana fans were seeing very similarly efficient basketball teams for those eight seasons.
Out of the 60 teams to reach the Final Four since 2010, 32 were outside the top-20 in either offensive or defensive efficiency. Only 5 – NC State (2024), FAU (2023), VCU (2011), Butler (2011), Michigan State (2010) – were outside the top-20 in both.
Every season prior to 2025 featured at least one team outside of the top-20 in offensive or defensive efficiency.
Some extremes since 2010 included Alabama ranking 11th in defensive efficiency in 2024, Miami (FL) ranking 99th defensively in 2023 (sorry, Hoosiers), South Carolina ranking 91st offensively in 2017, and Louisville ranking 112th offensively in 2012. All of these teams were very efficient on the other side of the floor.
Indiana ranked 15th in the FBS (4th in Big Ten) in EPA/play allowed within the red zone.
In a recent Under The Hood interview with Rhett Lewis, Bryant Haines noted that a high priority this offseason has been finding ways to be better in the red zone defensively. He half-joked that Curt Cignetti has reinforced that priority. Indiana wants to improve there, and for good reason.
The Hoosiers allowed opponents to enter the red zone just 32 times, the 3rd-fewest nationally, and, as noted above, they allowed the 15th-lowest EPA/play within those attempts. However, Indiana also ranked 56th in score rate allowed (81.3%). It allowed 26 scores on those 32 trips, and 18 of those scores were touchdowns. That’s not exactly ideal.
The chart below puts this into context on the FBS level.
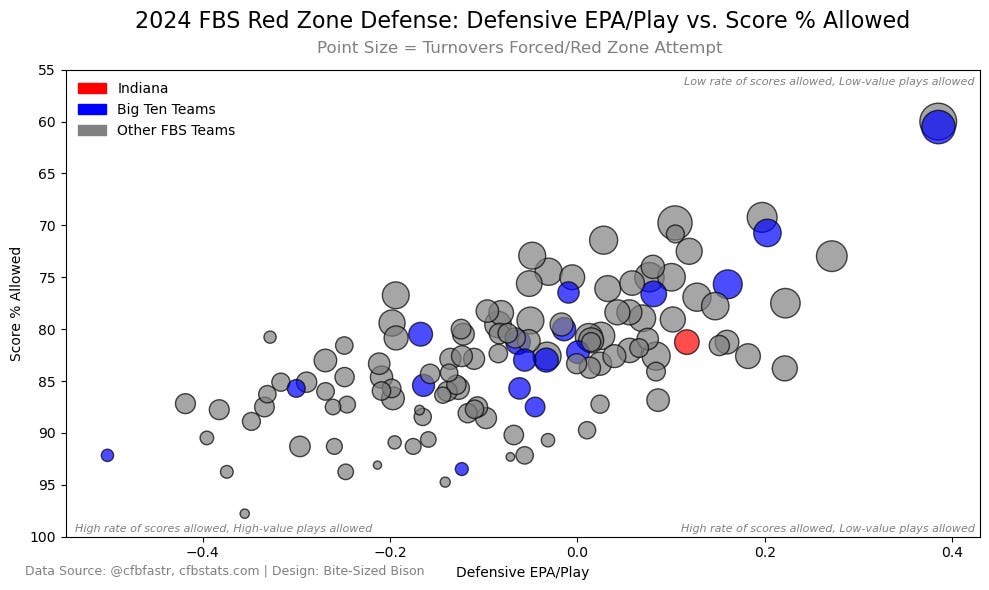
We can see now why this is a priority for a defense that ended the season with the 5th-best defensive EPA/play in the FBS and the 6th-fewest points per game allowed. The touchdowns surrendered in the red zone represented 53% of the points surrendered by Haines’ defense.
Indiana’s depth of tackle on runs to the A-gap was 2.11 yards. The nationwide average was 2.75. (credit: Brett Kollmann)
If you don’t know, the A-gaps are either side of center, which is why these averages are so small. I’ve shown the graphic below often, but Indiana was the strongest rushing defense in the CFB field during the back-half of the season.
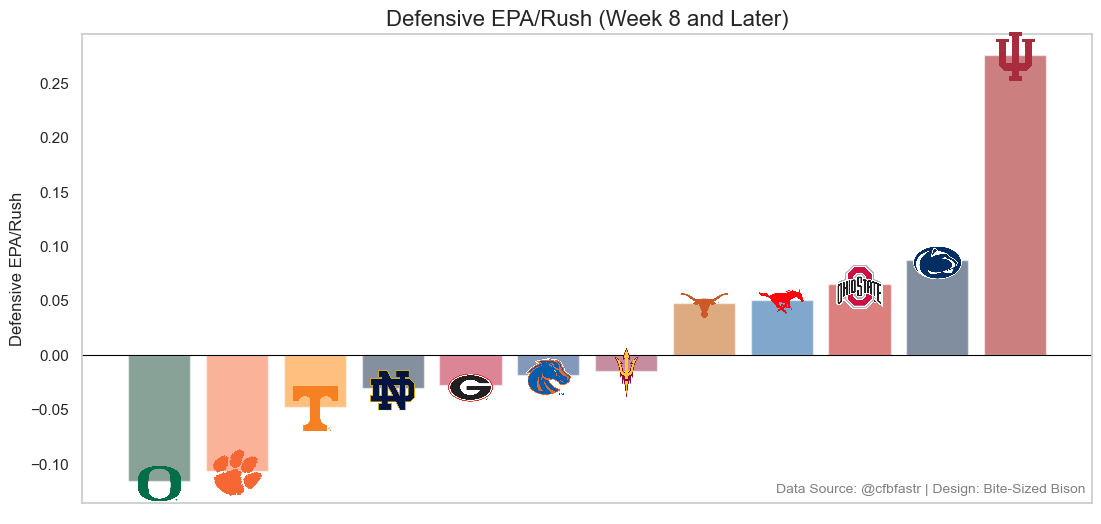
But this also extends to the full season, where Indiana allowed the third-fewest yards per carry (2.74). So the Hoosiers allowed fewer total yards per carry than the average team allowed through the A-gap!
This is how Bryant Haines & Company roll, and it’s one of the reasons why Pat Kuntz’s role on the staff as interior DL coach is so significant. They attack the center of the offensive front. They do this in many different ways, but the nose tackle defines the spearhead, and in 2025, that was CJ West. Listen to his interview at the Shrine Bowl here, where he discusses some of this.
Indiana’s defense allowed 100+ rushing yards to opposing offenses just five times, and in those games, it allowed just one big carry through the A-gap – a 75-yard score by now-Hoosier Roman Hemby (yes, the blocking referee play). Remove that carry, and Indiana allowed 2.19 yards per carry to the A-gap in its worst rush-defense games (and would only have four games of 100+ rushing yards by opponents). Below is how Indiana performed in the A-gap for those five games:
Charlotte: 7 carries, 12 yards
Maryland: 10 carries, 108 yards (Roman Hemby – 4 carries, 87 yards)
Washington: 7 carries, 8 yards
Ohio State: 5 carries, 12 yards
Notre Dame: 7 carries, 14 yards
This A-gap success is a major reason why West graded as the 11th-best starting DT in the FBS and the 8th-best run defense DT. It also is tape that is being heavily studied by NFL scouts ahead of the Draft this month.
What does that mean for Indiana in 2025? Well, West ranked 192nd among starting FBS DTs in snaps played (420) during the 2024 season. It’s the second-fewest among the top-25 graded DTs as well. A key reason for that is that Tyrique Tucker (306 snaps) was right behind him in that role. Tucker actually played 35% of the snaps where Indiana had a DL aligned with the A-gap – West 44%, James Carpenter 17%, others 4%. So it could be argued that Tucker deserves some of the credit for Indiana’s interior rushing success defensively.
Going into 2025, Indiana obviously carries its staff and approach from last season to this season, and it may well promote Tucker into West’s role. It also added Texas State transfer DT Dominique Ratcliff – who graded as the 18th-best FBS DT in 2024 – as an interior presence. Tucker, though, carries more experience in the A-gap than any DT currently on roster, which would mean either a heavy load for Tucker, an adjustment to DL rotations, or another addition to the interior DL (perhaps behind Tucker).
Kurtis Rourke clustered with several QBs in the 2025 NFL Draft class (via CFBNumbers).
CFBNumbers does similar work to Bite-Sized Bison, combining data science with football analysis, and they recently released a fun K-means clustering exercise with the 2025 NFL Draft class. They explain what clustering is within the post, but essentially, it’s a way to classify objects based on their features. In their exercise, they used 85 stats/characteristics to represent the features and then clustered the QBs, both among themselves and among past QBs enter their respective drafts. Here’s a visualization of that clustering.
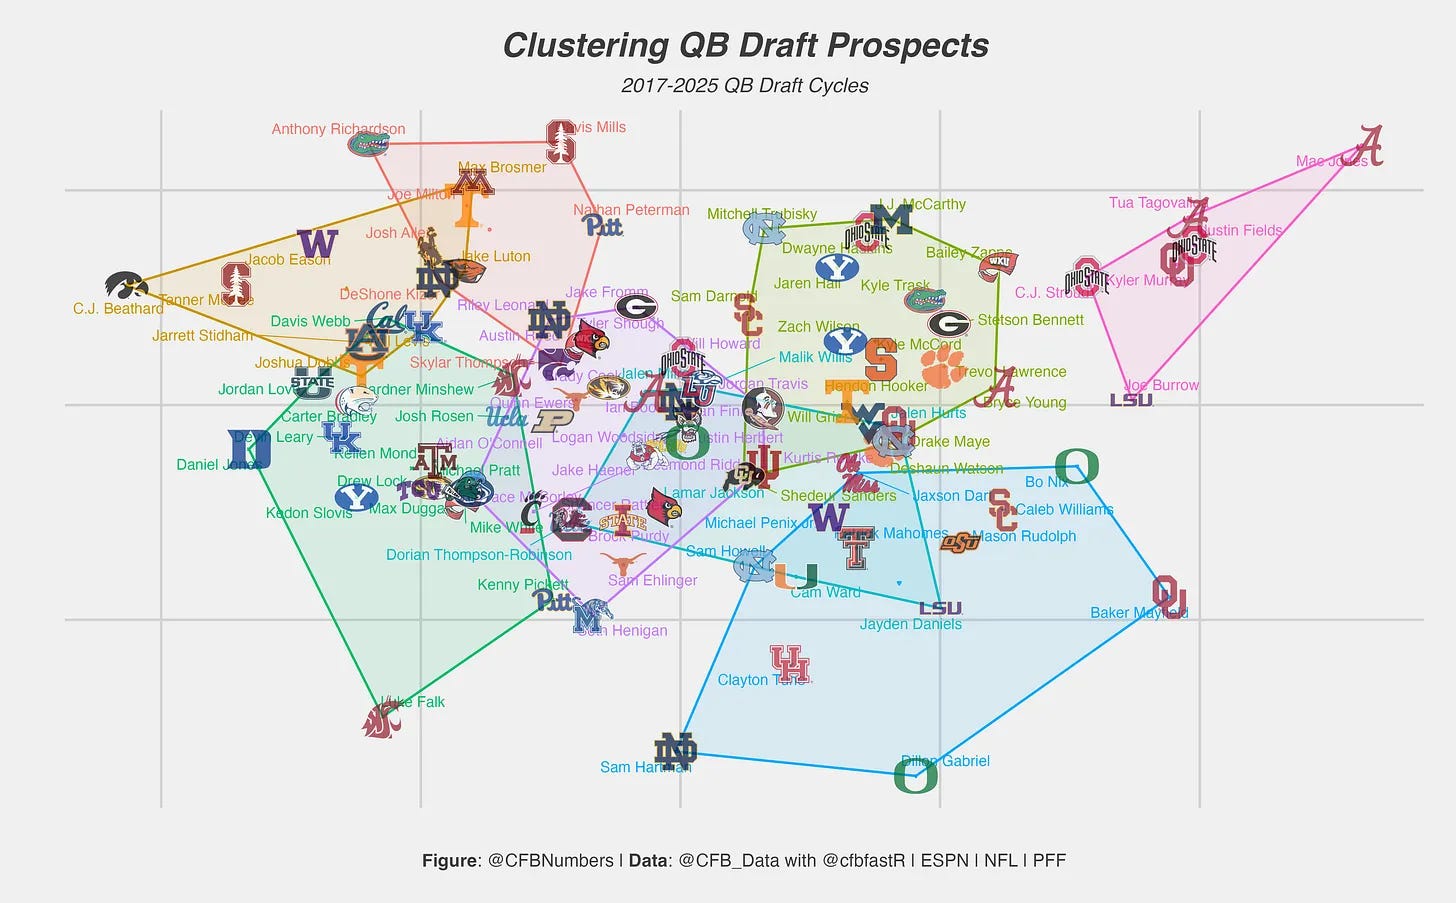
Something from this visualization that makes Kurtis Rourke an optimistic case for the NFL is that he (and Shedeur Sanders) are basically central to a cluster that also contains QBs like Patrick Mahomes, Michael Penix, Lamar Jackson, and Justin Herbert close by. Rourke was close to Herbert often throughout the analysis, actually. Centrality is crucial in clustering, as clusters are determined by each points’ distances from central points. It’s important to note that these clusters are not necessarily comparing styles but performance and execution during college years (as well as some style, of course).
CFBNumbers also did some great analysis about the QB class in general and compiled several NFL mock drafts released so far to develop a sort of consensus for predictions. Kurtis Rourke appears to be expected in the 7th Round.
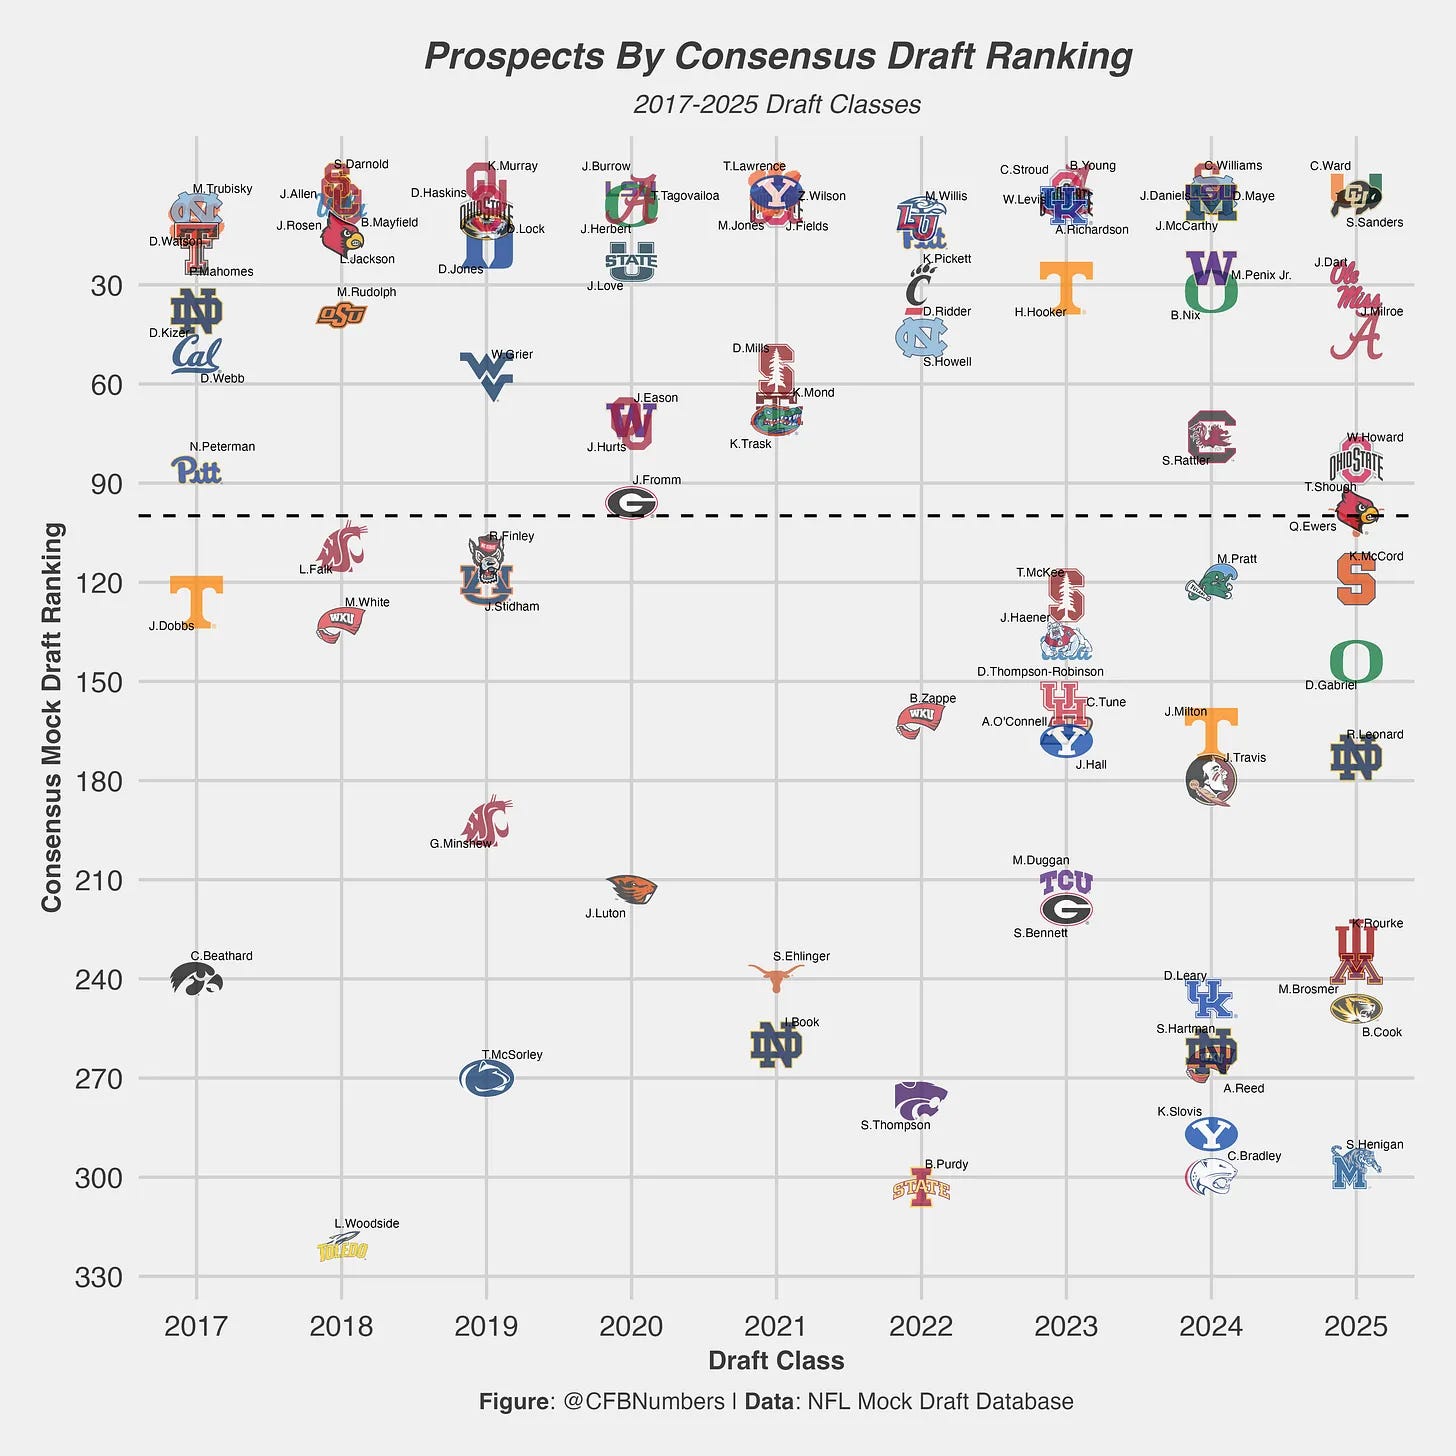
I think the challenge many scouts will face with Rourke is that he played most of his college days at the MAC level and then was plugged into a hyper-efficient offense designed by a coordinator who is a leading offensive mind in the FBS. Now, Rourke is just being cleared for throwing (he did a bit of throwing at a Colts camp recently), as he recovers from his torn ACL. How do you separate Rourke from his production and systems in college to determine his potential ability at the next level?
One last visual from that CFBNumbers piece tries to sort current and former QB draft classes into tiers.
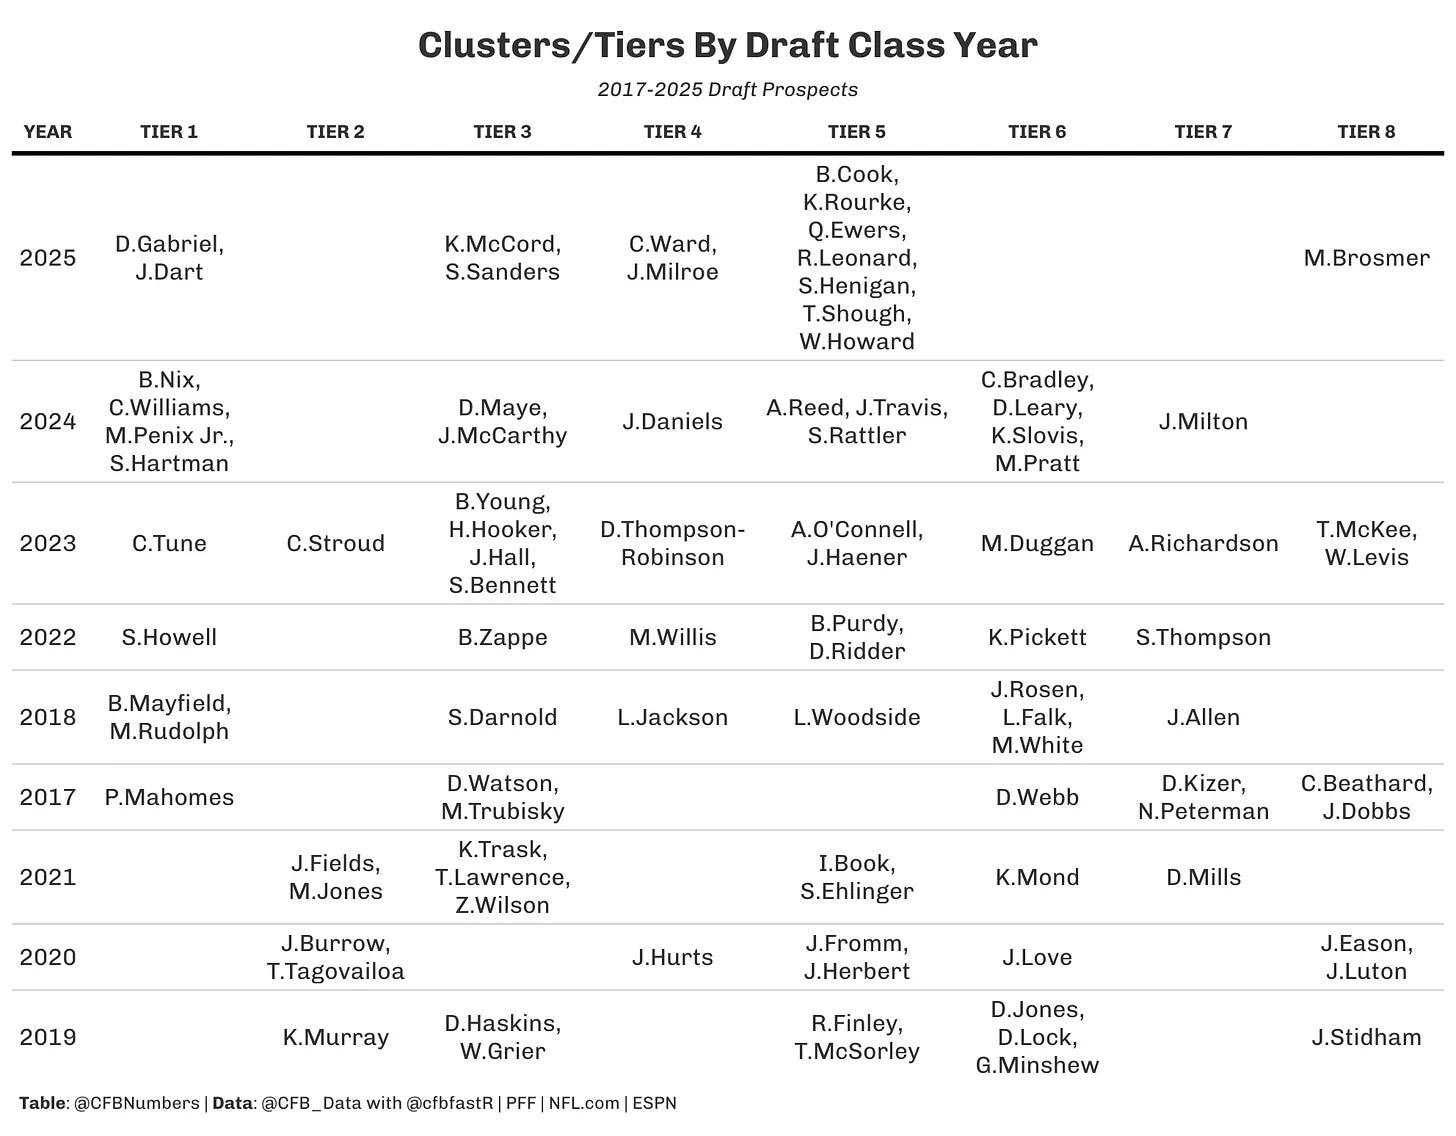
This is all in estimation, of course. There are countless variables, so it’s difficult for anyone to perform analysis that is exactly correct in its predictions, but this helps in sort of setting up expectations for Rourke in the Draft.
I highly recommend reading the CFBNumbers piece. It’s linked here.
I love the analysis of efficiency in the A gap. I don’t notice such things but it helps me understand why the defense works.