

Bison Bites: Dispatch #7
Data bites touching on: Kurtis Rourke's insane efficiency, Indiana's sudden improvement in relation to other programs, and Indiana beating up on its schedule


If you’re new enough to Bite-Sized Bison, you might not be familiar with Bison Bites. Each dispatch of Bison Bites is intended to be a quick-hitting list of approximately 3-5 statistics of interest between typical Bite-Sized Bison posts. This is the first mid-season edition!
Kurtis Rourke is spinning up a Heisman candidacy
Indiana QB Kurtis Rourke has been everything Indiana could’ve hoped for when he committed to the program in December. He’s never been this efficient (71.8% completion rate; 5th nationally), never pushed the ball downfield this consistently (10.1 yards per attempt, 2nd nationally; 10.1 average depth of target, 23rd nationally), and never been pressured less (58 pressured dropbacks; 2nd nationally). He was given a golden opportunity with OC Mike Shanahan and QB coach Tino Sunseri, and against Ohio State, Rourke will most likely break into the top-10 list of passing seasons in Indiana Football history, passing Babe Laufenberg’s 1982 season of 2,468 yards. At 21 passing touchdowns with two games remaining in the regular season, he is also in the hunt to break Kellen Lewis’ all-time record of 28 in 2007.
The interesting fact about Rourke’s brilliance in this offense is that it was never going to result in gaudy numbers. He is only used on 41% of Indiana’s offensive plays, which ranks 105th among FBS QBs, and he ranks 65th in attempted passes. To the surprise of many (coming into the season), Indiana actually ranks 24th in rushing attempts. So Rourke has to make every dropback count. And he has, with an FBS-leading 0.43 EPA/play.

Rourke is currently in legendary company within this metric (EPA/dropback since 2014). He ranks 12th among every QB to record at least 200 dropbacks. The issue is that 200 dropbacks isn’t that many dropbacks. Mike Penix threw 220 passes in six games in 2020. So I drew a comparison to Dillon Gabriel in 2023 (384 attempts), which if Rourke continues at his efficient pace through at least the next three games, he could come within comparable territory. That would be insane value to match, as Gabriel threw for more yards at Oklahoma in 2023 (3,660) than any Indiana QB has ever thrown for and had a 30-to-6 TD-to-INT ratio. While that sheer production is likely out of reach for Rourke, his efficiency is the difference.
Some other observations from that chart:
2019 Tua Tagovailoa, who started the majority of a season where Alabama appeared in the National Championship, is a very good comparison to current Kurtis Rourke. He graded as the 4th-best QB by PFF that season, completing 71.4% of his passes for 2,838 yards and a 33-to-3 TD-to-INT ratio on just 252 attempts in 9 games. Rourke sits at 71.8% for 2,410 yards and a 21-to-4 TD-to-INT ratio on 238 attempts in 9 games.
2020 Mike Penix had plenty of moments, including the pylon stretch against Penn State and 491 passing yards against Ohio State (2nd-most ever by an Indiana QB during a single game). But his relatively low EPA/dropback value is further evidence toward just how inefficient that offense really was.
2015 Nate Sudfeld is better comparison to Kurtis Rourke than some might remember. Sudfeld was the 7th-least pressured QB in the country and had an effective rushing attack with two thousand-yard rushers in Jordan Howard and Devine Redding. However, Sudfeld threw significantly more often than Rourke, and it resulted in the most passing yards by an Indiana QB in program history (3,573).
2019 Joe Burrow was simply insane. He completed 76.3% of his 527 passes for nearly 5,700 yards, 60 TDs, and just 6 INTs. We may never see something like that again. Oh, and Kurtis Rourke is one spot above Burrow in EPA/dropback currently!
Here’s a look at where Rourke sits next to QB Heisman winners since 2014.

I don’t believe Rourke will win the Heisman Trophy. Ashton Jeanty at Boise State is simply amazing, and Travis Hunter is a 1-of-1 athlete at Colorado. But for an award that has gone to 8 QBs in the last 10 seasons, it’d be tough to find a better QB right now.
Is Indiana’s sudden improvement the greatest of all time?
No, but it’s still very impressive!
The chart below uses Net EPA/play (offensive EPA/play minus EPA/play allowed) and compares each season’s Net EPA to the previous season’s Net EPA to show growth between seasons. As the chart shows, top-right means there was high improvement between seasons with high performance. That is where this 2024 Indiana team sits.
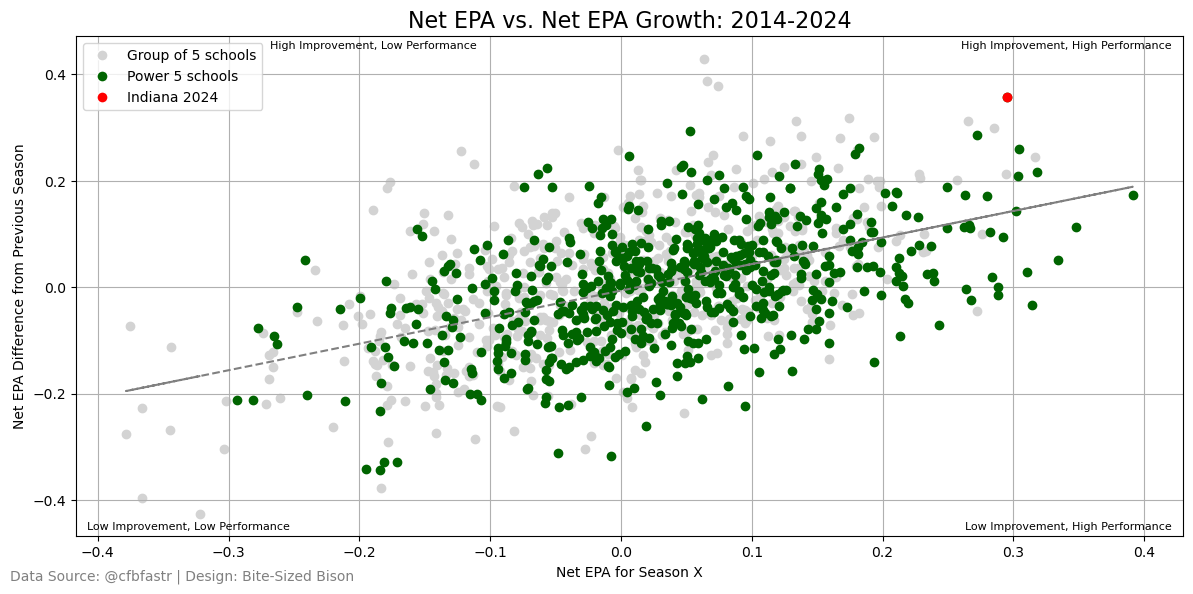
What is shown in the chart is that no one within a Power 5 (now Power 4) conference has made the year-over-year improvements Indiana has made, in the time frame that this metric has been available. There have been three Group of 5 teams to make greater improvements in one offseason than Indiana, but they didn’t come close to Indiana’s performance.
Below is a list of 60 teams — the top-30 and the bottom-30 — that bookend the progression and regression sides of this measurement.
While Indiana’s 2024 single-season improvement is impressive, what’s also astonishing is the fall of defending-champion Michigan (as well as Florida State) this year. Both are comparable to the fall of Indiana from 6-2 2020 to 2-10 2021.
There is plenty to glean from the scatterplot above, so I broke it out into four different versions of itself below.
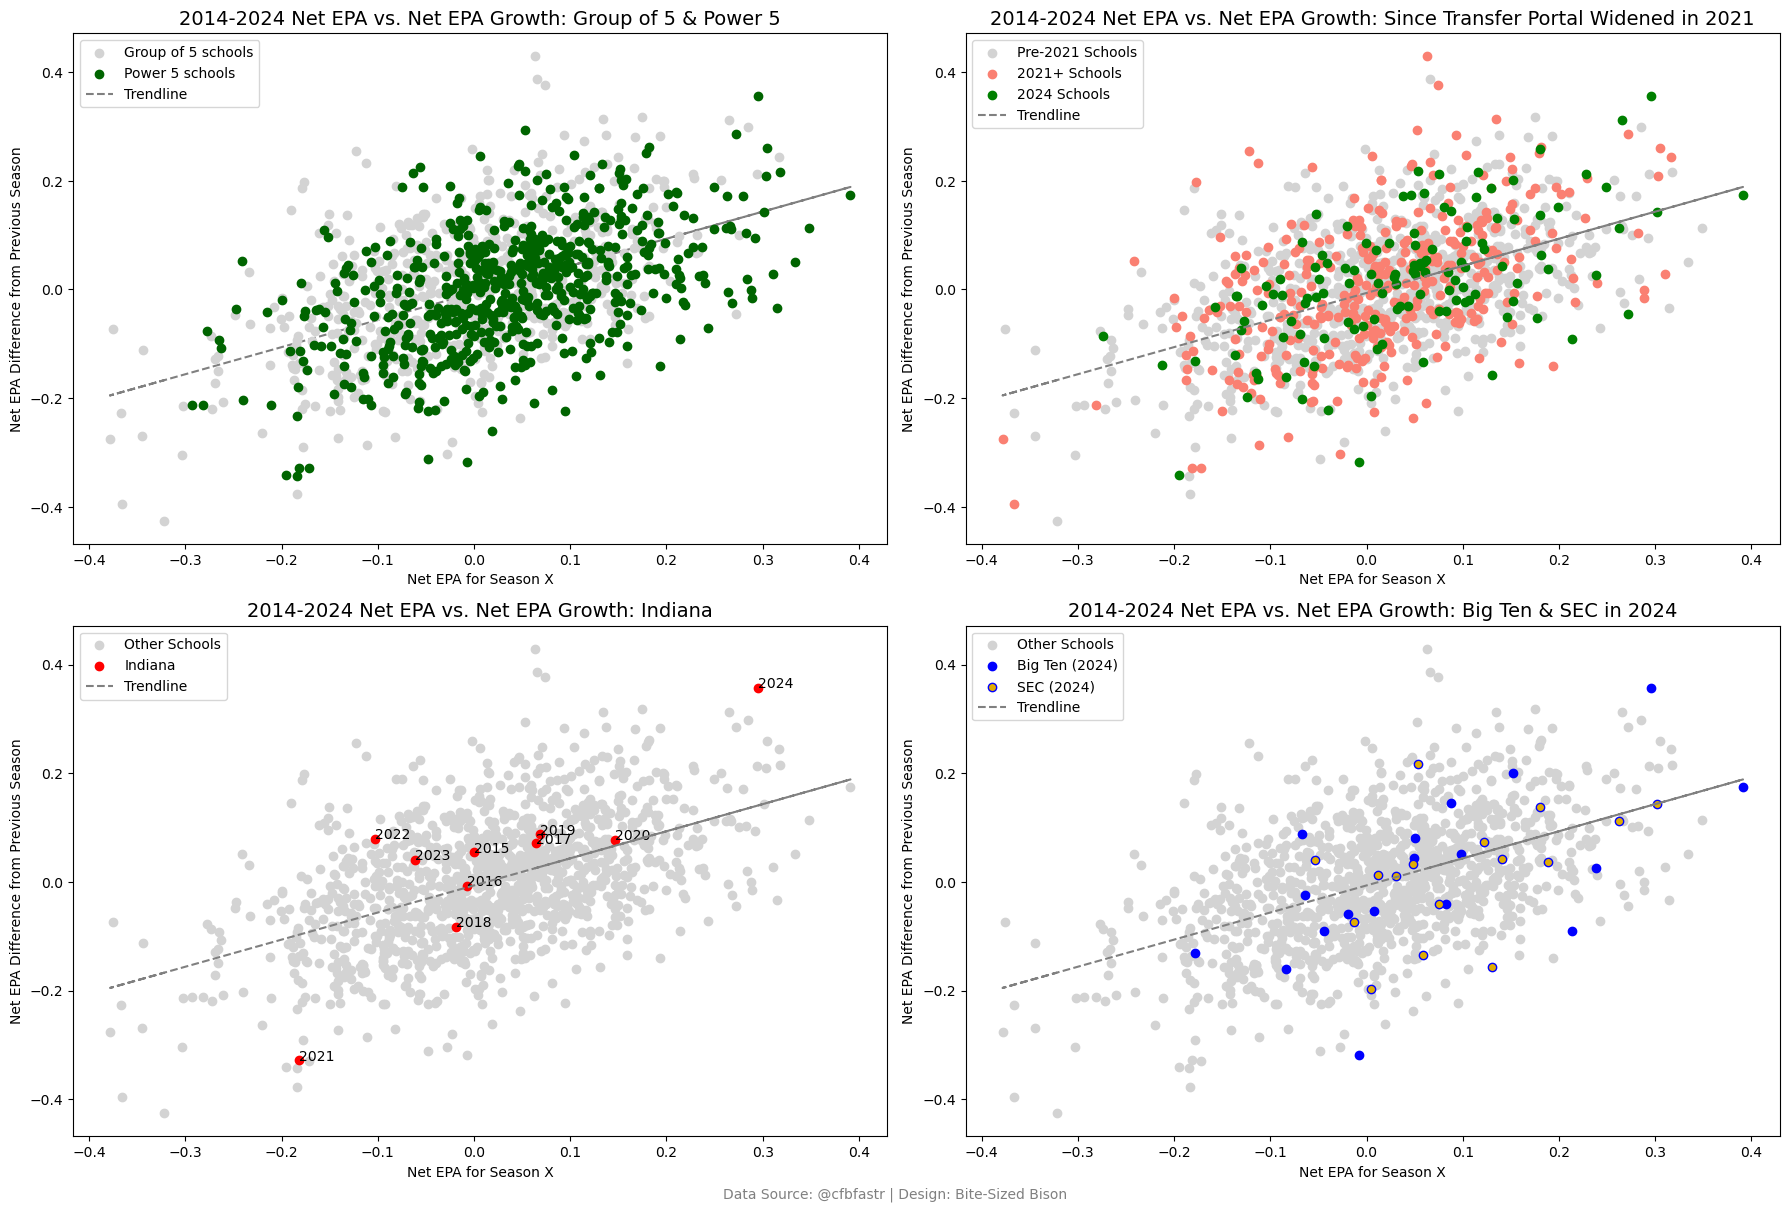
Some observations:
There seems to be a lot more variance in Group of 5 teams from season to season than in Power 5 conferences (see the gray dots above and below the cloud of green dots). This isn’t necessarily surprising (especially given the transfer portal now), but the rise and fall of G5 teams from year to year is real.
I create the top-right chart to explore the effects of the transfer portal on team improvement from year to year (2021 is when the portal exploded due to a lifting of transfer limitations by the NCAA). What is shown suggests — based on the number of green 2024 dots above the trendline — that teams are getting smarter with the portal. When you look below the trendline, there are more salmon-colored dots (2021-23 teams) and fewer green 2024 teams, meaning not as many teams were getting better from year to year during that span of seasons. There is also a notable number of teams in the bar chart above that are from the 2021-24 range, suggesting greater improvement and regression with the portal. Indiana is a good example of this.
Indiana had done a good job staying above the trendline for improvement from year to year. It just didn’t result in much success, especially during the Portal Era.
In the chart comparing the Big Ten to the SEC, there aren’t too many takeaways, other than that the bottom of the Big Ten is probably weaker than the bottom of the SEC. But when a chart looks like this, there aren’t many definitive conclusions to be made on a single metric. That is actually notable, given conversations happening about the Big Ten and SEC online.
How badly has Indiana beaten up on its schedule?
According to ESPN FPI, Indiana’s strength of schedule is 100th in the nation, and that is probably fair. However, it’s strength of record, again according to ESPN FPI, is 6th in the nation. This means that the Hoosiers have been beating up on their weaker schedule. This is obvious if you’ve watched the games, but here’s some quick data on how that’s true.
The chart below plots each Indiana opponent by its net success rate against Indiana (highest to lowest) relative to its season-long net success rate.

You can see that only one team has posted a positive net success rate against Indiana (Michigan). Michigan is also the only team to outperform its season-long success rate against Indiana. Other than that, Indiana has been a train, holding all of its opponents well below their season-long figures (which account for all games played this season, not just those before meeting IU). That is quite a feat, considering only four of their opponents have positive net success rates.
So does any of this help Indiana’s resume? There are some benefits (in terms of success rates):
In terms of net success rates, Indiana has been the largest or second-largest loss for six of its opponents — Charlotte (largest), FIU (largest), Michigan State (2nd-largest), Maryland (largest), Washington (2nd-largest), and Nebraska (2nd-largest).
Michigan State actually has had a +5% success rate margin against three opponents — Michigan, Boston College, and Iowa (+12%) — yet Indiana laid waste to the Spartans in East Lansing, with a -6.5% margin.
Three opponents on Indiana’s schedule have posted +7% or better success rate margins on Iowa.
Nebraska, who is on a 4-game losing streak beginning with Indiana, will always have the game where it posted a positive net success rate against Ohio State and gave the Buckeyes a scare. The Cornhuskers also beat Colorado in Week 2, but that looks far different then than it would today.
Purdue has yet to beat an FBS opponent, so this comes as no surprise, but waiting on the other side of Ohio State is an opponent that has failed to record more than a net 0% success rate against any team not named Indiana State.
To unluck the safe to the most valuable jewels in the resume, Indiana will need to beat Ohio State, who is analytically the best team in the country and owns five of the top 30 blowouts by opponents on Indiana’s schedule.
The opponents on the resume are not uber-impressive, but that’s not all that decides the strength of a resume. The first bullet point above, the fact that Indiana hasn’t lost any of its 10 games so far, and all of the other data shown in previous BSBs up to this point supports the fact that this Indiana team is a contender.
Tremendous explanation of complex statistics given in an easy to grasp format. Excellent presentation,Taylor. Thank you :-)
So much information! IU belongs on the field with the best teams this year. Next week IU gets a chance to solidify their place. Earlier this season I was watching Alabama v Georgia and wondered if IU would ever play in a game at that level. The answer is yes.