

Bison Bites: Dispatch #8
Data bites touching on: Big Ten MBB scoring differentials, splitting running game credit in the FBS, and investing in the trenches proving to be wise for Indiana


If you’re new enough to Bite-Sized Bison, you might not be familiar with Bison Bites. Each dispatch of Bison Bites is intended to be a quick-hitting list of approximately 3-5 statistics of interest between typical Bite-Sized Bison posts.
MBB Scoring Differential in Big Ten Conference Games
As I was watching Indiana take on another early deficit against Michigan State on Tuesday, I wanted to find a way to compare and visualize scoring pace during conference games. The below visualization was the result (completed Wednesday, Feb. 12).
Explainer: Each plot shows scoring differential by minute (1-40) for each Big Ten team during its conference games. The shaded region is constructed by the max (good) scoring differential and the minimum (bad) scoring differential at each minute of a given game. Then the line is the average scoring differential at each minute. The line will show how each team’s trend during a game, and the shaded region conveys a degree of consistency – particularly a consistency to play to any opponent. The figure is sorted by average scoring differential at the end of games.
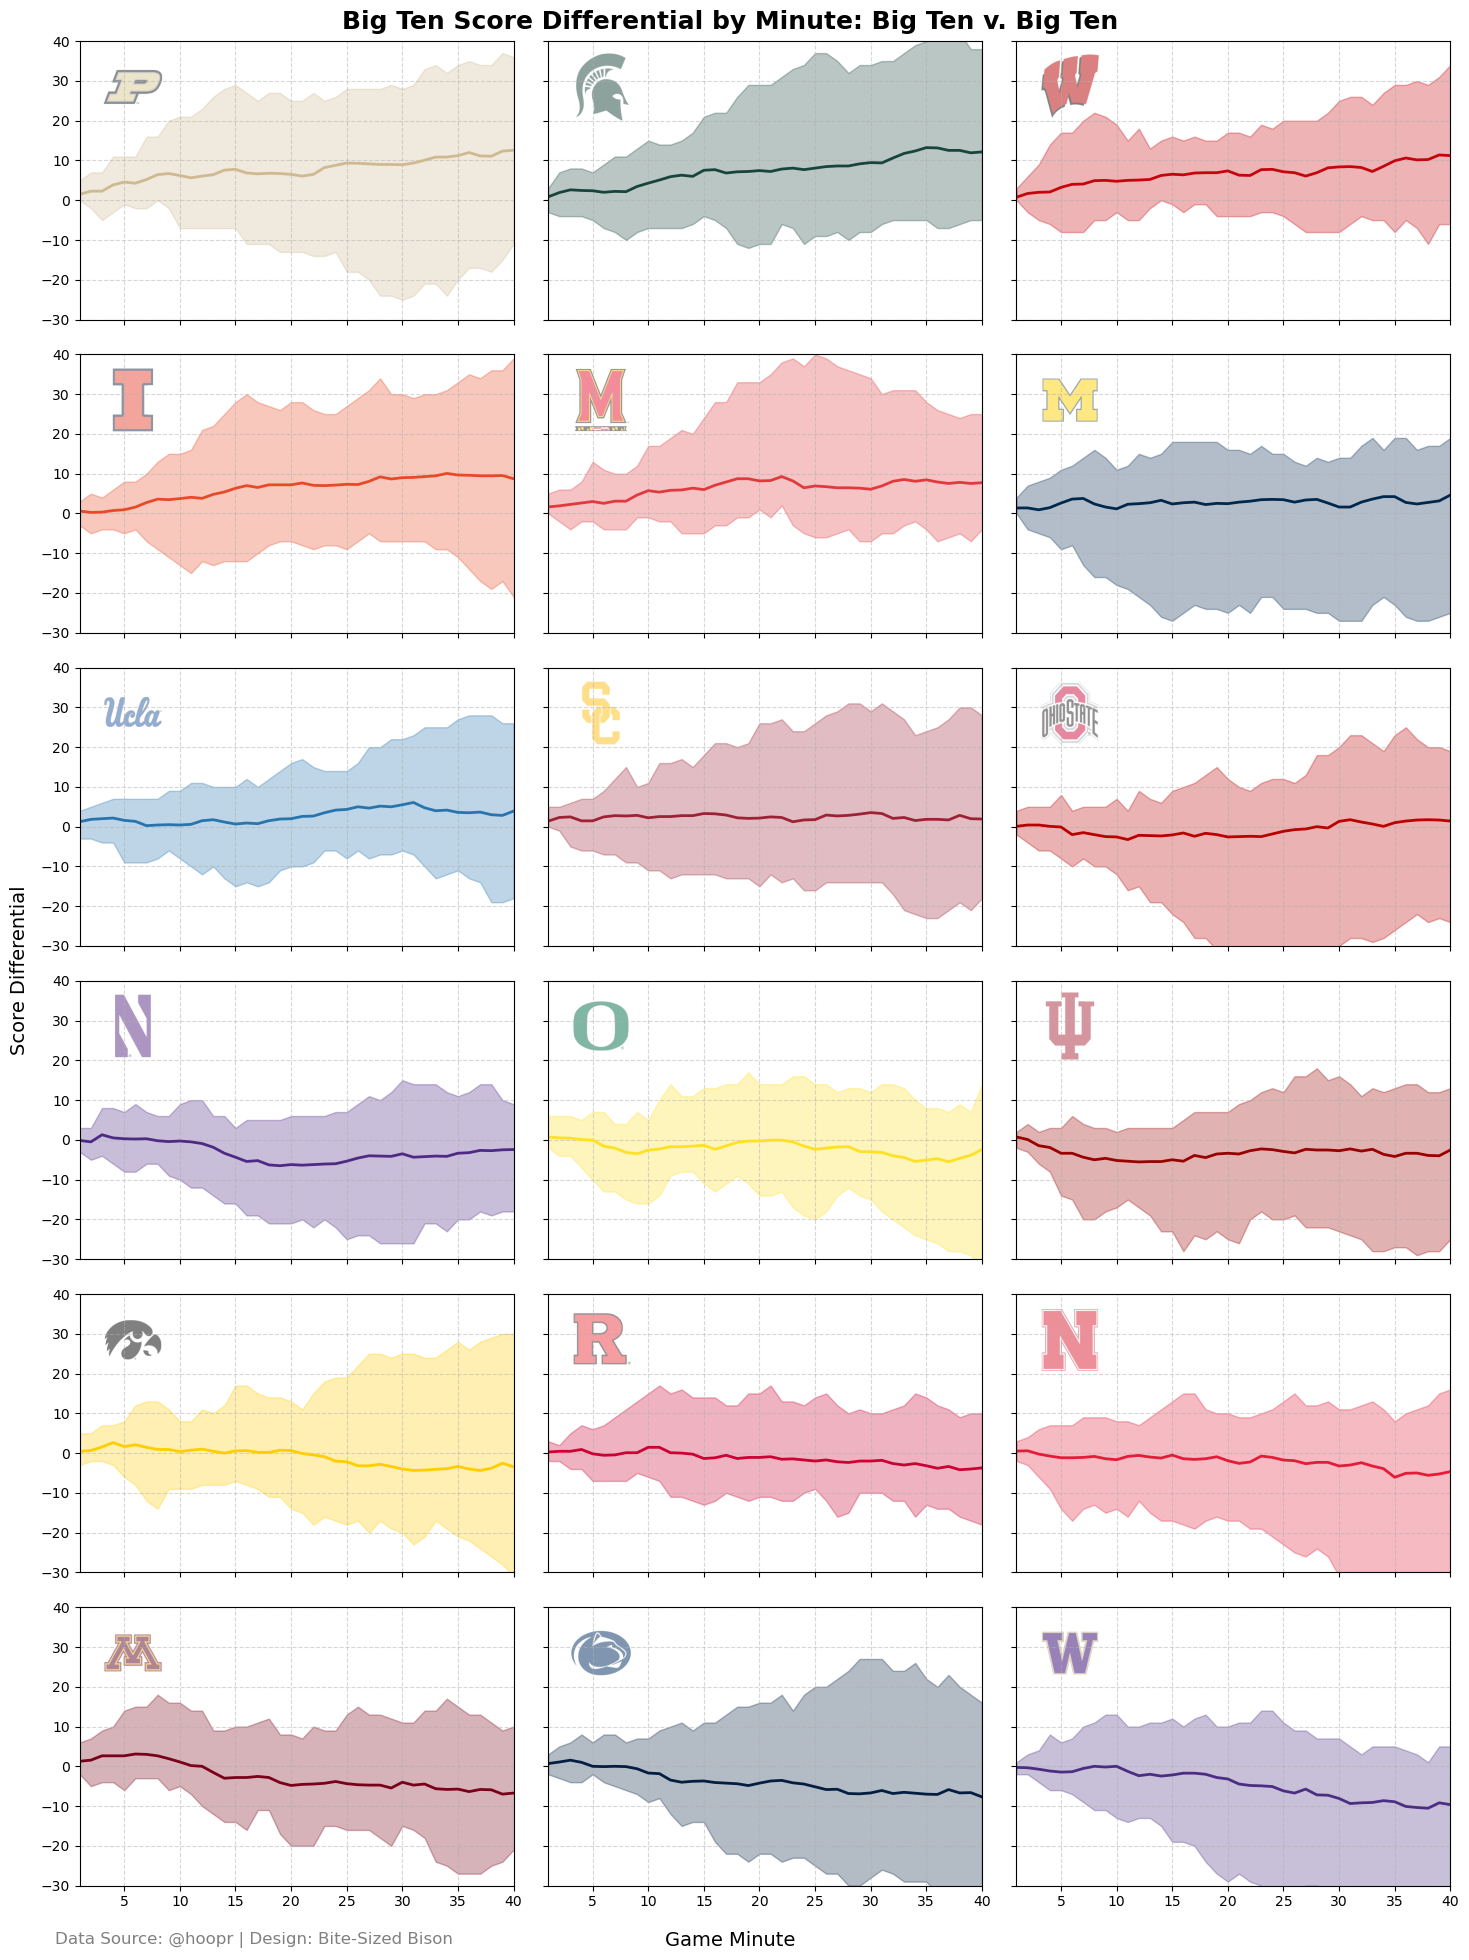
There is quite a bit of information here, and it’s a visualization meant to sit with for a minute. I’ll start with some observations about Indiana:
That tendency to start slowly is real. Indiana is last in the Big Ten in average score differential at the end of 10 minutes (-5.2 points). The next worst is Oregon at -2.6. Indiana not only gets off to bad starts, it gets off to abysmal starts when related to other conference teams.
The tendency to fight back into games should also be credited. The Hoosiers are 7th in the conference in average score differential change (+2.5 points) from the 10th minute to the 30th.
It’s already been established that Indiana doesn’t start well, but it’s under-12 subs don’t help either. There is a clear downward continuation in average score differential beginning at the 8th minute, following the under-12 substitutions. There isn’t much upward trend until right around the under-8 timeout.
Those maximums of the shaded region are defined by games against Minnesota, USC, Rutgers, and Penn State. The minimums are defined by massive losses to Nebraska, Iowa, and Illinois, as well as the eventual win against Michigan State (as noted above). That win over Michigan State also helped define some of the minimums near the end of MSU’s plot.
Let me know of other observations you might notice (about IU and others) in the comments!
Crediting Rushing Success to RBs and OLs/OCs
The chart below (by Parker Fleming of CollegeFootballInsiders.com) works to split rushing attacks into two pieces – RBs and OLs/scheme – and seek out where credit is due. The further right you go, the more yards that were gained before the carrier felt contact, and the further upward you go, the more yards that were gained after contact by the RB.
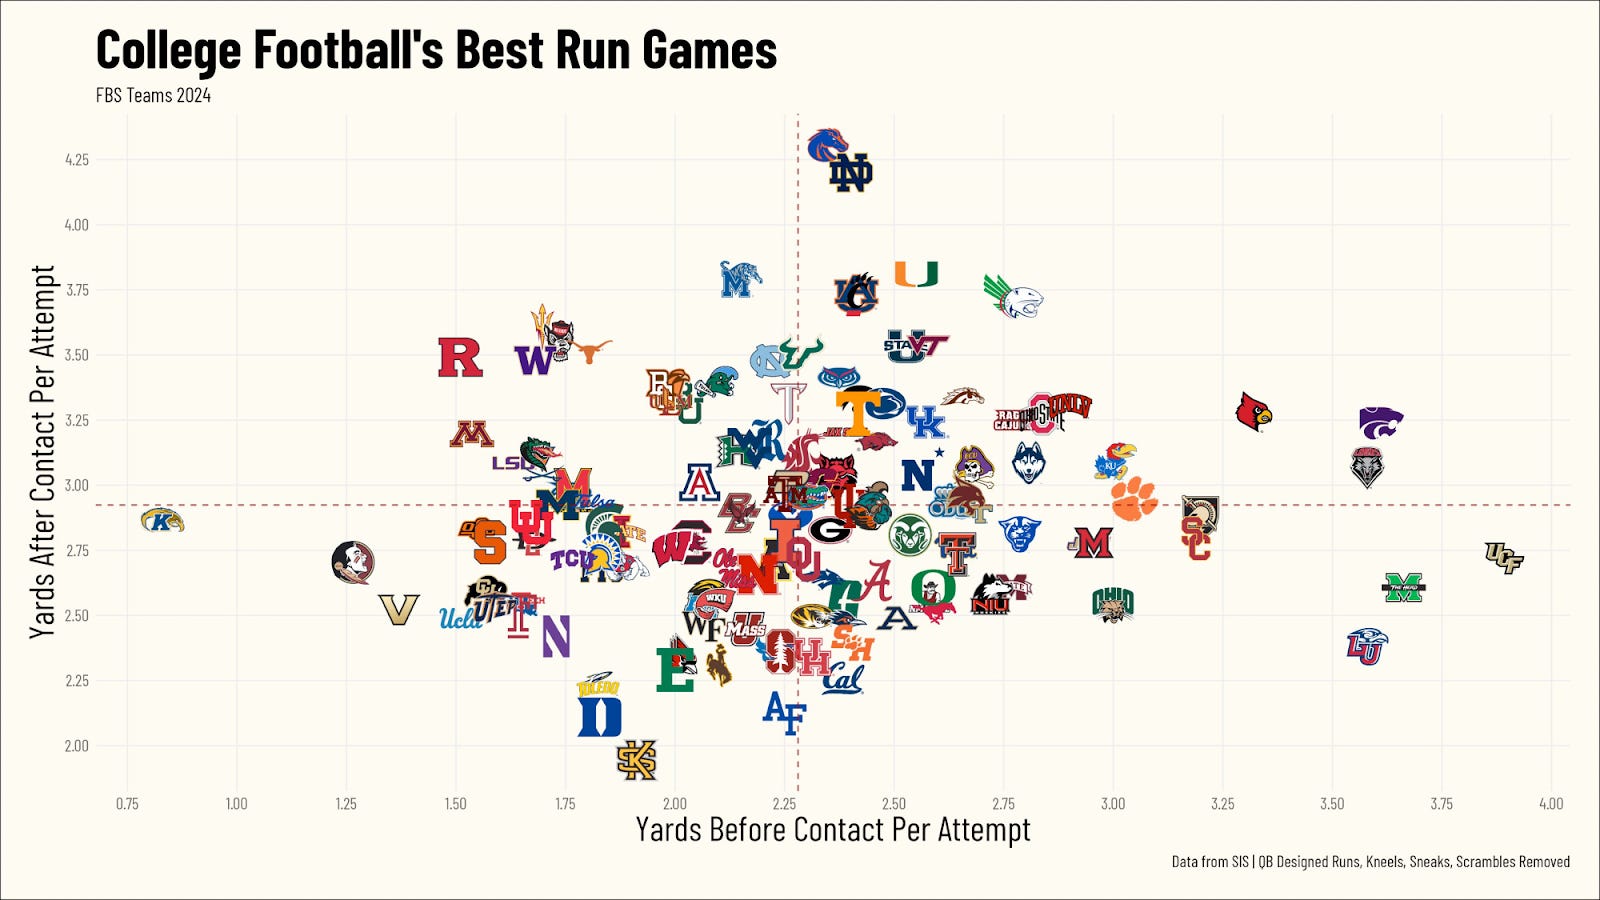
In a previous BSB, offensive line yards per rush were discussed, detailing how Indiana fell to 71st nationally in the metric from 2023 to 2024. This metric in the chart above is a bit different in that it measures how far the ball carrier ran before contact, versus measuring the push the OL got on a rush, so the OC’s scheme is much more of a factor. Many teams have offensive lines that get push and still don’t produce, so scheme is important. And Mike Shanahan deserves credit for scheming an effective rushing attack after taking over an offense that finished 102nd in the nation in rushing yards per game (120) during the 2023 season.
Largely, the rushing attack was average in 2024. The Hoosiers finished 55th in EPA/rush and 63rd in rushing yards per game. As mentioned above, Indiana was 71st in line yards per rush, and you can see where the Hoosiers stand in the chart above. Ty Son Lawton and Justice Ellison finished in the 25th and 14th percentiles, respectively, in missed tackles forced among FBS RBs with 100+ carries.
This chart can also inform us on who Indiana is bringing in, particularly for new RBs Roman Hemby (Maryland) and Lee Beebe (UAB). Their offensive lines were, to put it bluntly, terrible. Hemby had a former DT starting on his OL, and Beebe’s OL (seen in the chart) allowed even fewer yards before contact. Some of the most talented RBs of 2024 are in that top-left quad – Jonah Coleman at Washington, Cam Skattebo at Arizona State, Makhi Hughes at Tulane, Mario Anderson at Memphis, Kyle Monangai at Rutgers – but their lines didn’t help in maximizing production. Indiana now has two of those top-left quad RBs on its roster.
Noted in a previous BSB, Beebe ranked 13th nationally in percentage of yards gained after contact (74%).
Indiana is now investing $2 million in assistant salaries along the lines
A concept the Super Bowl strengthened is that teams win by building in the trenches. The Philadelphia Eagles simply dominated the Kansas City Chiefs up front on both sides of the ball, which sparked much of the success the Eagles found throughout the game.
Jeff Stoutland, beginning with his work at Alabama in 2011-12 (where his OLs paved the way for thousand-yard seasons for Trent Richardson, Eddie Lacy, and TJ Yeldon) and now with his work in Philadelphia since 2013, will likely go down as one of the greatest OL coaches of all time. And defensively, Jalen Carter created such a mismatch at DT that Patrick Mahomes was pressured 17 times (sacked a season-high 6 times) all without a single blitz from Philadelphia. That is unreal.
Tying this to Indiana, the staff understands this concept. Between OL coach Bob Bostad and DL coaches Pat Kuntz and Buddha Williams, Indiana is investing $2.08M to offensive and defensive line assistants alone in 2025. That bar will only continue to raise as the program progresses, and it shows the staff holds strong belief in building through the trenches.
[RELATED: Indiana's Increased Assistant Salary Pool Ahead of 2025]
Since Curt Cignetti arrived, he’s stressed the trenches by all of the following points:
He brought along DC Bryant Haines, who’s designed one of the most aggressive – if not the most aggressive – DL pass-rush schemes in the nation.
He maintained OL coach Bob Bostad, a highly respected OL coach, who was added much too late in the Tom Allen Era, following years of inadequate OL construction and development. Bostad had immediately brought positive change to the OL in 2023 (as noted in a previous BSB), and he was given a massive raise to $900,000 this offseason.
Before 2024, Cignetti kept LT Carter Smith in Bloomington, fending off Ohio State, and he brought in RT Trey Wedig from Wisconsin. He also pulled center Mike Katic back into the program. This resulted in one of Indiana’s best offensive lines since the 2015 season.
This offseason, the staff has worked to raise the floor of the offensive line, bringing in three offensive linemen, pulling Zen Michalski from Ohio State, returning Kahlil Benson from Colorado, and dropping a bag for Notre Dame center Pat Coogan.
Before 2024, in addition to Mikail Kamara, James Carpenter, and Tyrique Tucker (all from JMU), the staff dropped a bag for DT CJ West in the portal. West became Indiana’s key asset on defense, particularly later in the season, and is now seeing his stock drastically increase for the NFL Draft following the Shrine Bowl.
This offseason, Cignetti kept Kamara in Bloomington, added one of the most sought-after DTs in the portal (Hosea Wheeler), and also added one of the most productive DTs in the FBS (Dominique Ratcliff), creating the makings of a DL that mirrors the Eagles’ 2024 DL in a lot of ways.
Behind the scenes, the staff has also added a plethora of young linemen too, as they brought in Daniel Ndukwe and Mario Landino late in the 2024 class and then added five more DLs and three OLs from high school in the 2025 class. Their first commitment to the 2026 class is on the OL.
The quick bulking on both sides of the line – in numbers, talent, and investment – show that this staff adheres to the idea that the trenches define the quality of a football team. This wasn’t always the case before Cignetti. Kevin Wilson felt this way about offenses, but offensive line play dwindled during the Allen Era, and, while Allen added DL talent like Andre Carter and Dasan McCullough, the DL as a whole served a more passive role than it now does under Haines.
Great comments on football! Very informative.