


IUMBB Preview: Michigan
A quick preview of Indiana Men's Basketball's next matchup against the Michigan Wolverines


After the announcement that Mike Woodson will be retiring at the end of the season, there’s little left to say about this Indiana Men’s Basketball team. Bart Torvik gives Indiana a 6.5% chance to make the Tournament, but it’s really not about that anymore. At this point, this is a team that knows its fate, so how does it respond?
The road ahead — with eight games remaining — has five home games and two games KenPom projects Indiana to win (Penn State and Washington). Outside of those two, there are good teams that have shown tendencies to lapse against fairly mediocre opponents, such as Michigan State (has lost two straight), UCLA (lost to Rutgers, Nebraska, and UNC this year), Oregon (has lost five of its last six), and then Ohio State (lost to IU already) and Purdue (at Assembly).
Then there is this Michigan team, which has been hanging by a thread recently. Since losing to Minnesota on a buzzer-beater by Dawson Garcia on Jan. 16, Michigan has gone 4-1, losing to Purdue by 27 and owning an average scoring margin of just 3.75 points per win in that span. Those are wins against Northwestern, Penn State, Rutgers, and Oregon. This team, led by Dusty May, is not infallible.
The issue is that the Wolverines are built extremely similarly to Wisconsin, who Indiana had no answers for earlier this week. Both play big at the four and five — Michigan with two 7-footers — and both fire (and convert) a ton of threes. One key difference, though, is that Michigan is far better in terms of defensive analytics, which could help them at Assembly.

Observations
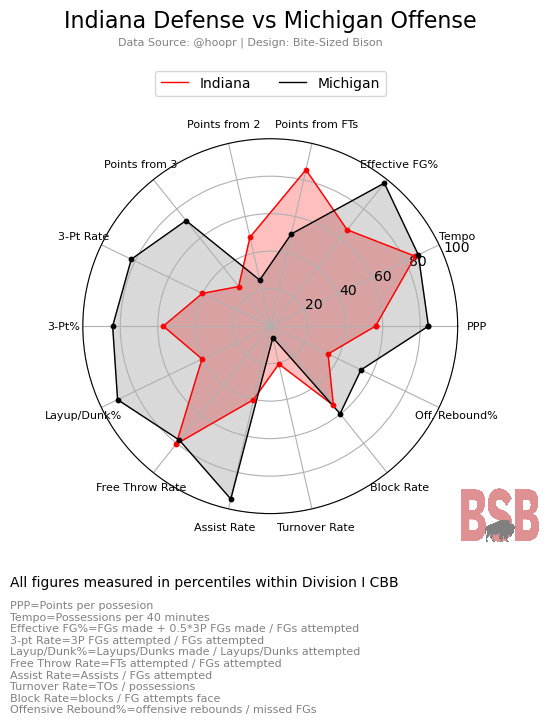
Indiana vs. Michigan:
In Indiana’s last seven games, it’s surrendered double-digit 3-point conversions five times and is allowing opponents to shoot 40% from behind the arc. At this point, that is just who the Hoosiers are defensively, and they’ll need to pray Michigan goes cold Saturday. Michigan’s 3-point numbers are extremely similar to Wisconsin’s, as Michigan ranks in the 80th percentile in attempted threes per game (25.8) and in the 85th percentile in 3-point percentage (36.8%).
Michigan really stretches the floor with its two 7-foot bigs — Danny Wolf and Vladislav Goldin. Wolf, at the five, averages a double-double, attempts an average of 3 threes per game, averages 3.6 assists per game, and is a top-10 defensive rebounder nationally. Goldin, at the four, is the team’s leading scorer, with 15.6 points per game, and is one of the most efficient interior-scoring players in the nation — 5th in true shooting percentage (69.3%).
Michigan owns roughly a 9-man rotation, and nearly all of them will be looking to shoot threes, including four — Tre Donaldson, Nimari Burnett, Sam Walters, and Danny Wolf — who all attempt 3.0+ threes per game and hit at least 37% of them (Wolf being the lowest). Burnett is a top-100 3-point shooter, hitting 43.4%, and Donaldson is just behind him, with 42.2%. Walters plays just 13 minutes per game but has attempted a three every four minutes of gameplay.
Michigan turns the ball over as much as anyone in Division I college basketball. The Wolverines average nearly 15 turnovers per game, most of them unforced. Indiana is well below average in forcing turnovers, so this may help the Hoosiers.
Teams that can shoot like Michigan definitely take the emphasis off of Indiana’s strength — Oumar Ballo inside — and as CrimsonCast noted this week, it didn’t seem as if Indiana had a coherent plan for Ballou against Wisconsin. Michigan is an even tougher interior matchup, on top of its spacing, so it will be interesting to see if any adjustments are made.
Key
PPP = Points per possession — PPP is a reliable measure of efficiency on either side of the floor and is calculated as it’s named.
Tempo = Possessions per 40 minutes played — Tempo conveys how quickly a team plays on offense or how its defense is able to slow tempo
Effective FG% = FGs made + 0.5*3P FGs made / FGs attempted — Effective field goal percentage is much like field goal percentage but with a weight applied to threes to somewhat account for range
Points from FTs, Points from 2, Points from 3 = Total points from each range / Total points scored — This simply shows how many points are coming from each range for each team.
3-pt Rate = 3P FGs attempted / FGs attempted — This metric answers the question: What percentage of a team’s attempted shots are from three? Even shorter yet: How often does a team shoot threes?
3-pt% = 3P FGs made / 3P FGs attempted — This is the traditional three-point percentage metric.
Layup/Dunk% = Layup/Dunk FGs made / Layup/Dunk FGs attempted — A traditional field goal percentage for layups and dunks; How well does a team convert its closest shot attempts?
Free Throw Rate = FTs attempted / FGs attempted — Very similar to 3-pt Rate, free throw rate seeks to convey how often a team shoots free throws, which can show how well a team draws fouls.
Assist Rate = Assists / FGs attempted — Assist rate conveys how well a team moves the ball, particularly as it relates to creating shots.
Turnover Rate = Turnovers / Possessions — Turnover Rate simply shows which proportion of possessions end in turnovers for a specific team.
Block Rate = Blocks / Opponent FGs attempted — How many shots does a team block?
Off. Rebound% = Offensive Rebounds / missed FGs — How often is a team gathering its own missed shots?
How to Read the Chart
Radar charts are super common in sports analytics, and if you’ve played sports video games, you’ve probably seen them before (typically in comparing the attributes of teams or players).
Each chart is intended to compare each side of the floor (IU’s offense vs. Opponent’s defense; IU’s defense vs. Opponent’s offense), and Indiana will always be red, while its opponent will always be black. The colored fill is intended to quickly show where an advantage/disadvantage is felt within each statistic.
For each stat, each team’s percentile within Division I college basketball is conveyed, which means the measure is in a pool of 300+ programs.
Some percentiles are fairly straightforward, such as 3-pt%; if an offense has a higher 3-pt% percentile, that means they make more of their threes than most D-I programs. But if a defense has a lower percentile within the same stat, it means it allows a better percentage of threes to be converted. Therefore, if there is a big gap between the two, then whoever makes a good amount of threes could have an advantage.
Some other stats are not as straightforward, such as Turnover Rate; if an offense has a high percentile within Turnover Rate, that means it doesn’t turn the ball over often, whereas if a defense has a high percentile in Turnover Rate, it forces more turnovers. Or Tempo: If an offense has a high percentile in Tempo, then it runs fast, but if a defense has a high percentile in Tempo, it allows a fast game.
The idea is that if there is a gap between the two values within each stat, the color that fills that gap has the advantage in that dimension.