


IUMBB Preview: Michigan State
A quick preview of Indiana Men's Basketball's next matchup against the Michigan State Spartans


At this point, it feels as if Indiana is limping to the finish line. Following their loss to Michigan (third straight loss at home), the Hoosiers now have a 3.4% chance to make the NCAA Tournament, according to Bart Torvik, and, as CrimsonCast cited from r/CollegeBasketball on Reddit, that community gives Indiana a 14.5% chance to miss its conference tournament (highest odds are a 13 seed, at 16.2%).
Nearly all focus has turned to the head coach search (see Zach Osterman’s inaugural hot board), but there are seven games remaining on the schedule, with Tom Izzo’s Michigan State Spartans due up.
Indiana will be the first Midwestern team the Spartans have played this month. Michigan State dropped both of its West Coast games against USC and UCLA but rebounded with a nice win at home against Oregon. Those two losses snapped a 13-game winning streak that included wins over North Carolina, Nebraska, Ohio State, and Illinois — all teams ranked higher by KenPom than Indiana (currently 55th). While Michigan State has some nice wins (particularly Illinois), it also has losses to Kansas (understandably), Memphis, USC, and UCLA. The Spartans’ toughest stretch is yet to come, with six (!!) top-20 teams after IU, leaving the quality of this team still somewhat unknown. KenPom gives Indiana an 18% chance to win, which is probably fair.
Observations
Indiana at Michigan State:
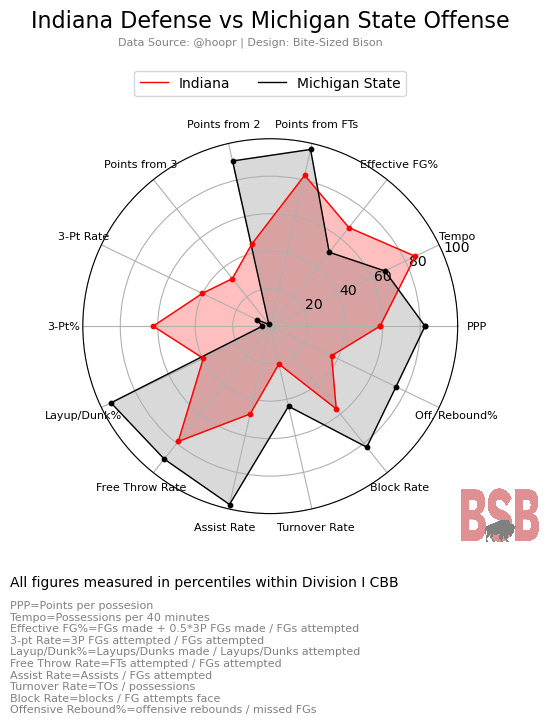
Michigan State’s strength is in its depth, where it has 10 players averaging at least 15 minutes played per game, and its leader — guard Jaden Akins — plays only 26 minutes per game. In MSU’s past five games, Jeremy Fears leads the team in time spent at one position, as he’s played 53% of MSU’s point guard minutes. For reference, Mackenzie Mgbako has played 56% of Indiana’s power forward minutes in the last five games. This is all to say that there will be many contributors and plenty of shifting pieces.
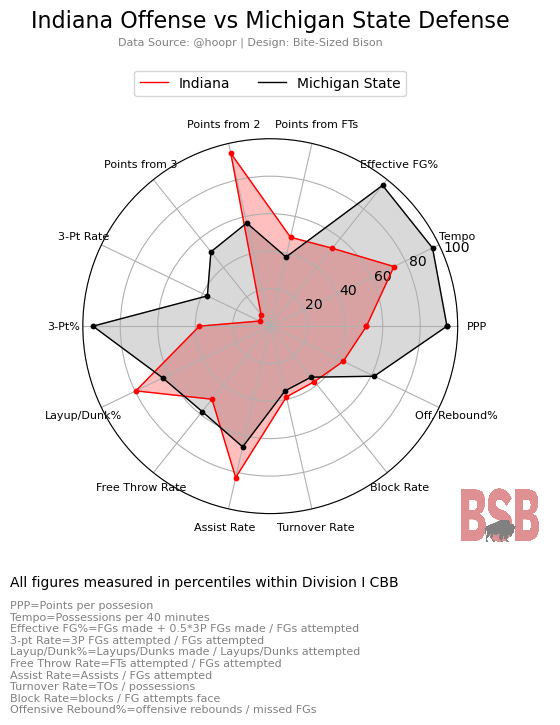
The Spartans rely on fundamental defense. It’s not necessarily a disruptive defense — just 11 turnovers forced per game and ranked 257th in allowed assist rate — but it allows the 15th-lowest effective field goal percentage, including just 29.5% from three, and it allows the 22nd-lowest offensive rebounding percentage.
Michigan State has a few standout contributors, such as Jaden Akins’ 13 points per game, Jaxon Kohler’s 7.8 rebounds per game — 19th- and 11th-best offensive and defensive rebounding rates — and Jeremy Fears’ 6.2 assists per game — 2nd-best assist rate nationally. Other than those statistical outliers, the rest is all hands on deck, with each of the 10 rotating contributors offering production.
Outside of Jaden Akins, the biggest offensive threat is freshman Jase Richardson, who scored 29 points against Oregon in Michigan State’s last game. He is MSU’s leading 3-point shooter, and while he only plays about 22 minutes per game, he ranks 34th nationally in KenPom’s offensive rating.
The Spartans will do most of their scoring inside, much like Indiana. These two teams combine for fewer than 39 attempted threes per game.
Michigan State gets to line as much as anyone in the country, as it ranks 14th in points from free throws and 22nd in attempted free throws.
Key
PPP = Points per possession — PPP is a reliable measure of efficiency on either side of the floor and is calculated as it’s named.
Tempo = Possessions per 40 minutes played — Tempo conveys how quickly a team plays on offense or how its defense is able to slow tempo
Effective FG% = FGs made + 0.5*3P FGs made / FGs attempted — Effective field goal percentage is much like field goal percentage but with a weight applied to threes to somewhat account for range
Points from FTs, Points from 2, Points from 3 = Total points from each range / Total points scored — This simply shows how many points are coming from each range for each team.
3-pt Rate = 3P FGs attempted / FGs attempted — This metric answers the question: What percentage of a team’s attempted shots are from three? Even shorter yet: How often does a team shoot threes?
3-pt% = 3P FGs made / 3P FGs attempted — This is the traditional three-point percentage metric.
Layup/Dunk% = Layup/Dunk FGs made / Layup/Dunk FGs attempted — A traditional field goal percentage for layups and dunks; How well does a team convert its closest shot attempts?
Free Throw Rate = FTs attempted / FGs attempted — Very similar to 3-pt Rate, free throw rate seeks to convey how often a team shoots free throws, which can show how well a team draws fouls.
Assist Rate = Assists / FGs attempted — Assist rate conveys how well a team moves the ball, particularly as it relates to creating shots.
Turnover Rate = Turnovers / Possessions — Turnover Rate simply shows which proportion of possessions end in turnovers for a specific team.
Block Rate = Blocks / Opponent FGs attempted — How many shots does a team block?
Off. Rebound% = Offensive Rebounds / missed FGs — How often is a team gathering its own missed shots?
How to Read the Chart
Radar charts are super common in sports analytics, and if you’ve played sports video games, you’ve probably seen them before (typically in comparing the attributes of teams or players).
Each chart is intended to compare each side of the floor (IU’s offense vs. Opponent’s defense; IU’s defense vs. Opponent’s offense), and Indiana will always be red, while its opponent will always be black. The colored fill is intended to quickly show where an advantage/disadvantage is felt within each statistic.
For each stat, each team’s percentile within Division I college basketball is conveyed, which means the measure is in a pool of 300+ programs.
Some percentiles are fairly straightforward, such as 3-pt%; if an offense has a higher 3-pt% percentile, that means they make more of their threes than most D-I programs. But if a defense has a lower percentile within the same stat, it means it allows a better percentage of threes to be converted. Therefore, if there is a big gap between the two, then whoever makes a good amount of threes could have an advantage.
Some other stats are not as straightforward, such as Turnover Rate; if an offense has a high percentile within Turnover Rate, that means it doesn’t turn the ball over often, whereas if a defense has a high percentile in Turnover Rate, it forces more turnovers. Or Tempo: If an offense has a high percentile in Tempo, then it runs fast, but if a defense has a high percentile in Tempo, it allows a fast game.
The idea is that if there is a gap between the two values within each stat, the color that fills that gap has the advantage in that dimension.
Looks like IU needs to stay with the zone defense after this win.