


IUMBB Preview: Ohio State
A quick preview of Indiana Men's Basketball's next matchup against the Ohio State Buckeyes


The implications of this afternoon’s game between Indiana and Ohio State in Bloomington are fairly simple: the winner takes the 9 seed in the Big Ten Tournament, the loser takes the 10 seed and plays on Wednesday — where a loss could topple any NCAA Tournament hopes, particularly for Indiana.
The Hoosiers are certainly not out of the woods yet. ESPN considers Indiana one of the Last Four In, while EvanMiya.com considers their resume to be Just Outside the Field and Bart Torvik gives Indiana a 30% chance. Indiana is also ranked 56th in the NET ratings and 45th by KenPom.
Since defeating Ohio State in Columbus on Jan. 17, Indiana has looked like a team that can compete with Tournament-caliber teams, beating Michigan State (in East Lansing) and Purdue while averaging a 6-point scoring margin in its seven losses since then. Most recently, it played Oregon competitively on the road. The Hoosiers have just allowed too many of those competitive games to slip through their fingers to be in a comfortable spot in March. That’s not even mentioning the blowout losses on the other side of that win in Columbus.
In this game, though, KenPom gives Indiana a 54% to win, and Haslametrics estimates the final score to be 74-73 in Indiana’s favor.
Ohio State was spotty at best in February, going 4-5 with its peak at a win over Maryland and its valley at a 21-point loss at home to Northwestern. The Buckeyes also played Nebraska (KenPom No. 50) twice — lost by 8 on the road, won by 2 in double-overtime last week. The non-conference wins over Texas (Nov. 4) and Kentucky (Dec. 21) are deep in the rearview now, as the Buckeyes have just three KenPom top-50 wins since then — Purdue (No. 14), Maryland (No. 12), and Nebraska (No. 50).
Ohio State’s resume is certainly being boosted by the early-season success, and Indiana has a chance to prove that to be true today, in relation to its own resume.
Observations
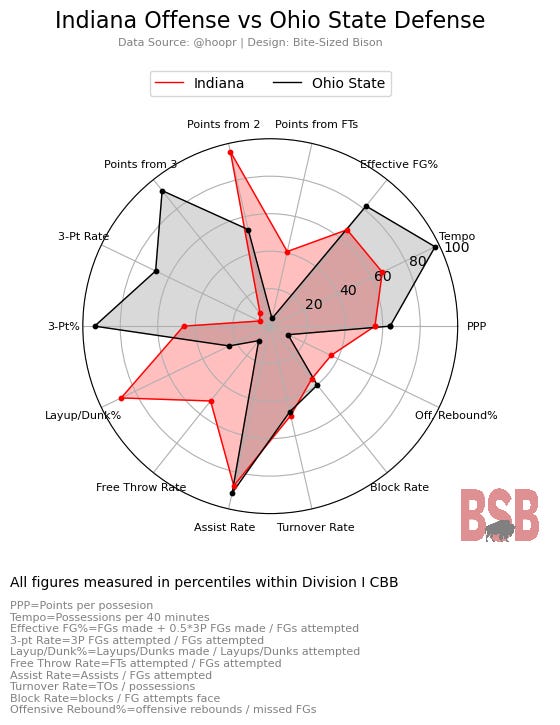
Indiana vs. Ohio State:
Indiana really attacked Ohio State in the post offensively in January, as Ohio State lacks size inside — 6-foot-9 Sean Stewart has played 45% of minutes at center during OSU’s last five games. Oumar Ballo scored 21 points and brought down 15 rebounds in that game, when Malik Reneau was absent. Indiana has now all but abandoned the two-big concept, with Ballo + Reneau lineups playing only 3.5% of minutes in the last five games. Ballo played 40 minutes against Ohio State in January; I wouldn’t expect that to be the case today.
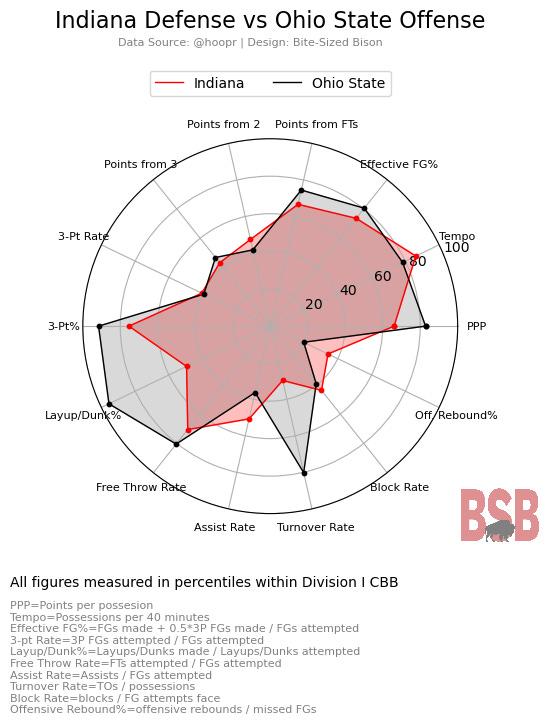
Ohio State doesn’t necessarily lean on its 3-point shooting, but it is a significant part of the offense, as the Buckeyes rank 32nd nationally in 3-point percentage (37.5%). Indiana has actually improved in perimeter defense, allowing teams to shoot 33% in its last 10 games. John Mobley hit 5 threes against Indiana in January, but Bruce Thornton can hit them too.
Ohio State is the best team in the country at preventing steals by its opponents, but this is negated by being one of the worst teams in the country (348th) in non-steal turnovers. Indiana’s improved backcourt defense could play there.
Indiana fans are understandably frustrated with officiating after the Oregon game that featured just 7 Indiana free throws, but fans should prepare for this Ohio State team’s whistle. The Buckeyes rank 15th in percent of opponents’ points surrendered at the stripe, and they they earn a disproportionate amount of their own points at the line too. They attempted 44 (!!) free throws against Nebraska earlier this week. And they rank top-100 in free throw percentage. Five of their 11 wins over Power 5 teams have come with fewer than 20 free throw attempts.
Key
PPP = Points per possession — PPP is a reliable measure of efficiency on either side of the floor and is calculated as it’s named.
Tempo = Possessions per 40 minutes played — Tempo conveys how quickly a team plays on offense or how its defense is able to slow tempo
Effective FG% = FGs made + 0.5*3P FGs made / FGs attempted — Effective field goal percentage is much like field goal percentage but with a weight applied to threes to somewhat account for range
Points from FTs, Points from 2, Points from 3 = Total points from each range / Total points scored — This simply shows how many points are coming from each range for each team.
3-pt Rate = 3P FGs attempted / FGs attempted — This metric answers the question: What percentage of a team’s attempted shots are from three? Even shorter yet: How often does a team shoot threes?
3-pt% = 3P FGs made / 3P FGs attempted — This is the traditional three-point percentage metric.
Layup/Dunk% = Layup/Dunk FGs made / Layup/Dunk FGs attempted — A traditional field goal percentage for layups and dunks; How well does a team convert its closest shot attempts?
Free Throw Rate = FTs attempted / FGs attempted — Very similar to 3-pt Rate, free throw rate seeks to convey how often a team shoots free throws, which can show how well a team draws fouls.
Assist Rate = Assists / FGs attempted — Assist rate conveys how well a team moves the ball, particularly as it relates to creating shots.
Turnover Rate = Turnovers / Possessions — Turnover Rate simply shows which proportion of possessions end in turnovers for a specific team.
Block Rate = Blocks / Opponent FGs attempted — How many shots does a team block?
Off. Rebound% = Offensive Rebounds / missed FGs — How often is a team gathering its own missed shots?
How to Read the Chart
Radar charts are super common in sports analytics, and if you’ve played sports video games, you’ve probably seen them before (typically in comparing the attributes of teams or players).
Each chart is intended to compare each side of the floor (IU’s offense vs. Opponent’s defense; IU’s defense vs. Opponent’s offense), and Indiana will always be red, while its opponent will always be black. The colored fill is intended to quickly show where an advantage/disadvantage is felt within each statistic.
For each stat, each team’s percentile within Division I college basketball is conveyed, which means the measure is in a pool of 300+ programs.
Some percentiles are fairly straightforward, such as 3-pt%; if an offense has a higher 3-pt% percentile, that means they make more of their threes than most D-I programs. But if a defense has a lower percentile within the same stat, it means it allows a better percentage of threes to be converted. Therefore, if there is a big gap between the two, then whoever makes a good amount of threes could have an advantage.
Some other stats are not as straightforward, such as Turnover Rate; if an offense has a high percentile within Turnover Rate, that means it doesn’t turn the ball over often, whereas if a defense has a high percentile in Turnover Rate, it forces more turnovers. Or Tempo: If an offense has a high percentile in Tempo, then it runs fast, but if a defense has a high percentile in Tempo, it allows a fast game.
The idea is that if there is a gap between the two values within each stat, the color that fills that gap has the advantage in that dimension.