

IUMBB Preview: UCLA
A quick preview of Indiana Men's Basketball's next matchup against the UCLA Bruins


Right when you’re ready to throw in the towel, this team pulls you back in. Indiana went on the road and defeated No. 11 Michigan State earlier this week, in a game that likely says more about Michigan State than it does about Indiana but no doubt increases intrigue around the Hoosiers. Bart Torvik had Indiana’s NCAA Tournament odds at less than 4% before its latest win, and now, the odds are at 19%.
It’s more than numbers too. This team, of course, will look awful in random games, such as the back-to-back losses against Iowa and Illinois in early-January. Since then, though, Indiana has seemed uncompetitive in one game — the loss at Wisconsin — playing some quality teams fairly closely.
This slight optimism could be unraveled with a loss to UCLA on Friday, but it should be a competitive game, as KenPom gives Indiana a 45% chance to win and UCLA is 5-6 outside of its home arena — 0-5 outside of its time zone. Indiana, though, has lost its last three games in Assembly Hall.
In case you missed it: In yesterday’s Bison Bites, the visualization below was included, depicting scoring differential by minute in Big Ten conference games.
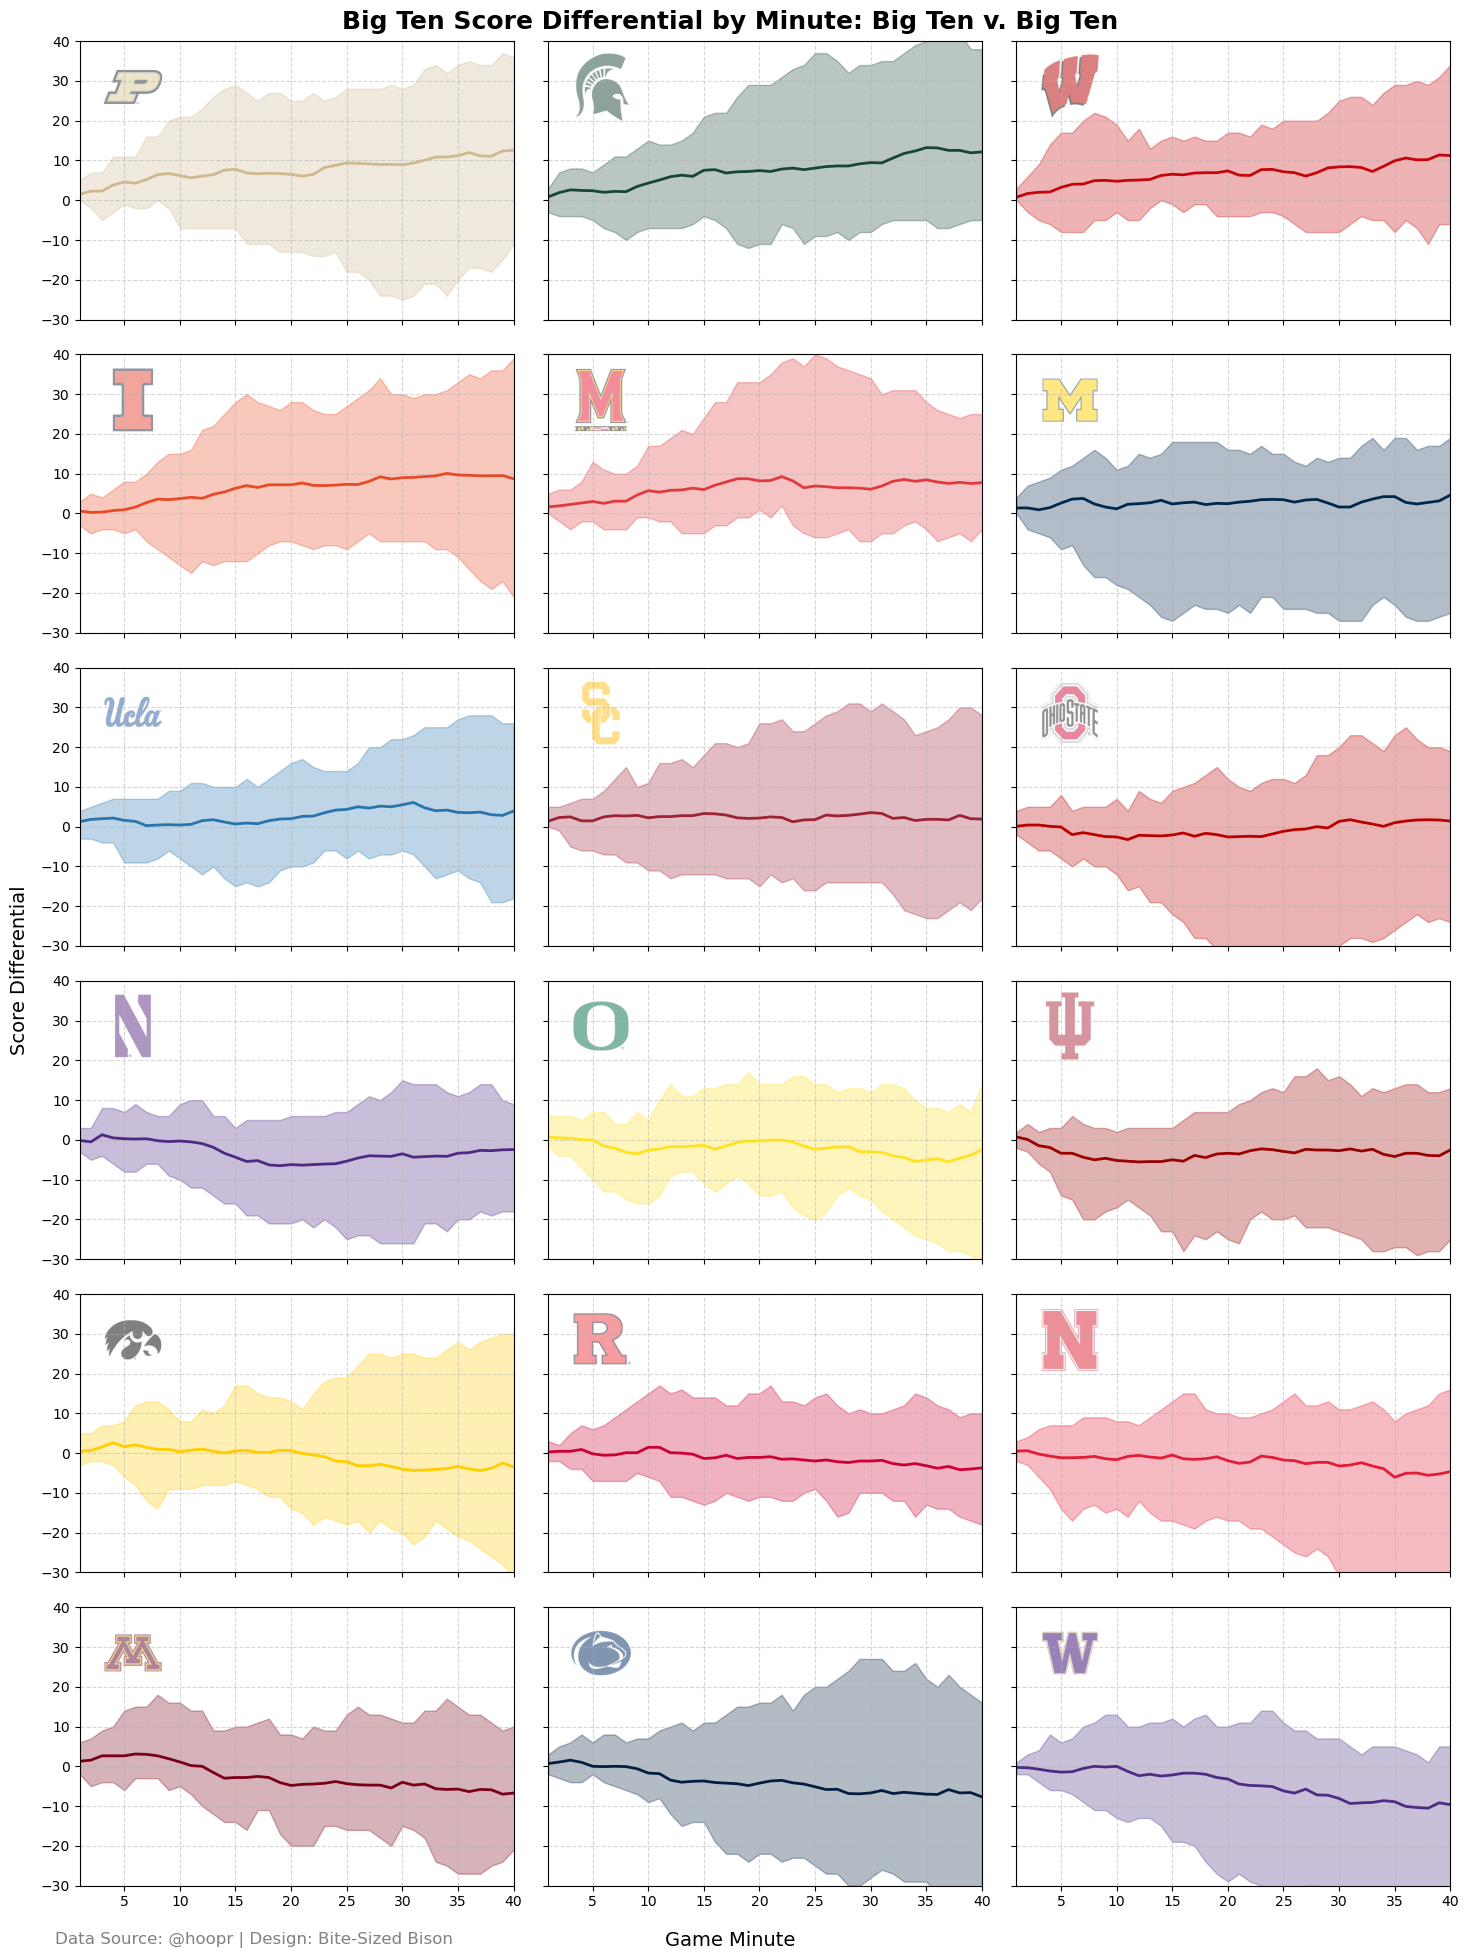
Indiana, as most of us know, gets off to the worst starts in the conference, but UCLA doesn’t start super strongly either. It’s the middle 20 minutes that could go a long way tonight. While Indiana fights its way back into games during the 10-to-10, ranking 7th in the conference in score differential change (+2.5), UCLA is even stronger in this stretch, ranking 3rd with +5.1. Indiana needs a stronger start than it’s found recently.
Read more about the above chart here.
Observations
Indiana vs. UCLA:
UCLA leans on its defense, ranked 12th nationally in defensive efficiency by KenPom and allowing just 65 points per game (24th nationally). It also forces turnovers on an incredible 24% of opponent possessions.
On offense, it’s a fairly simple approach. UCLA wants to slow the pace, move the ball, and find opportunities near the rim. The Bruins don’t rebound particularly well (329th in total rebounds), meaning second-chance scoring isn’t a large part of their game.
Three-point opportunities will be there for Indiana. While UCLA’s defense is disruptive, it isn’t exactly stellar at preventing shots from going down on opponent possessions. Teams score an above average proportion of their points from three against UCLA and will convert an average of 7+ threes. That’s not a ton, but it must happen to beat the Bruins.
Kobe Johnson is a key player for UCLA on both sides of the floor. He owns the best Defensive Rating in the starting lineup, is top-80 in steal rate, and even leads the team in rebounding. When he does attempt shots (only about 6 per game), he is efficient (48%). Most notably, though, he plays the three and four positions, meaning he will be matched up against Indiana’s best scorers outside of Oumar Ballo.
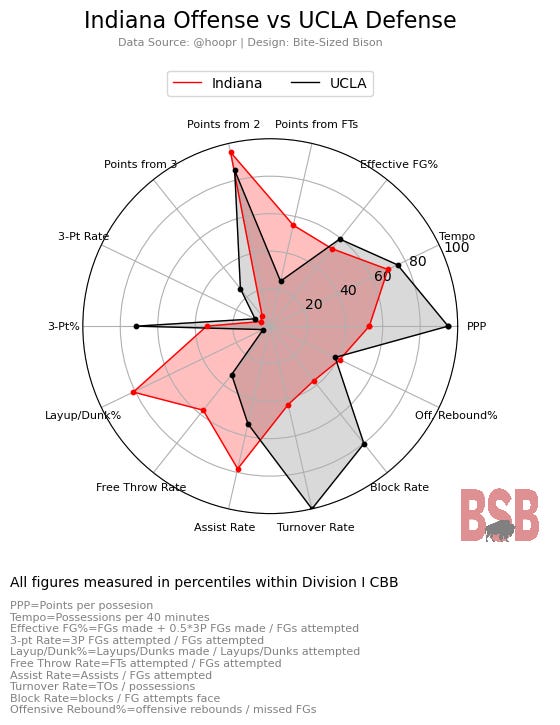
UCLA will surrender size to Indiana on the interior. The Bruins have 7-foot-3 Aday Mara, who only plays 42% of UCLA’s center minutes, but outside of him, UCLA goes with a combination of two 6-foot-9 forwards — one being a stretch forward in Tyler Bilodeau — at center. UCLA surrenders a high layup/dunk percentage (seen in the chart above), so Oumar Ballo should have a good night.
Nearly every contributor on UCLA’s offense is a threat from three, but the primary 3-point threat in the backcourt is Skyy Clark, who Indiana fans might remember from his recruitment days. Clark leads the backcourt with a 36.4% percentage, but it’s Tyler Bilodeau — the 6-foot-9 stretch forward — who is the biggest threat from deep, averaging as many threes as Clark and hitting 43.2% of them (94th nationally). He was 7-fo-12 from three in UCLA’s recent loss to Illinois.
Key
PPP = Points per possession — PPP is a reliable measure of efficiency on either side of the floor and is calculated as it’s named.
Tempo = Possessions per 40 minutes played — Tempo conveys how quickly a team plays on offense or how its defense is able to slow tempo
Effective FG% = FGs made + 0.5*3P FGs made / FGs attempted — Effective field goal percentage is much like field goal percentage but with a weight applied to threes to somewhat account for range
Points from FTs, Points from 2, Points from 3 = Total points from each range / Total points scored — This simply shows how many points are coming from each range for each team.
3-pt Rate = 3P FGs attempted / FGs attempted — This metric answers the question: What percentage of a team’s attempted shots are from three? Even shorter yet: How often does a team shoot threes?
3-pt% = 3P FGs made / 3P FGs attempted — This is the traditional three-point percentage metric.
Layup/Dunk% = Layup/Dunk FGs made / Layup/Dunk FGs attempted — A traditional field goal percentage for layups and dunks; How well does a team convert its closest shot attempts?
Free Throw Rate = FTs attempted / FGs attempted — Very similar to 3-pt Rate, free throw rate seeks to convey how often a team shoots free throws, which can show how well a team draws fouls.
Assist Rate = Assists / FGs attempted — Assist rate conveys how well a team moves the ball, particularly as it relates to creating shots.
Turnover Rate = Turnovers / Possessions — Turnover Rate simply shows which proportion of possessions end in turnovers for a specific team.
Block Rate = Blocks / Opponent FGs attempted — How many shots does a team block?
Off. Rebound% = Offensive Rebounds / missed FGs — How often is a team gathering its own missed shots?
How to Read the Chart
Radar charts are super common in sports analytics, and if you’ve played sports video games, you’ve probably seen them before (typically in comparing the attributes of teams or players).
Each chart is intended to compare each side of the floor (IU’s offense vs. Opponent’s defense; IU’s defense vs. Opponent’s offense), and Indiana will always be red, while its opponent will always be black. The colored fill is intended to quickly show where an advantage/disadvantage is felt within each statistic.
For each stat, each team’s percentile within Division I college basketball is conveyed, which means the measure is in a pool of 300+ programs.
Some percentiles are fairly straightforward, such as 3-pt%; if an offense has a higher 3-pt% percentile, that means they make more of their threes than most D-I programs. But if a defense has a lower percentile within the same stat, it means it allows a better percentage of threes to be converted. Therefore, if there is a big gap between the two, then whoever makes a good amount of threes could have an advantage.
Some other stats are not as straightforward, such as Turnover Rate; if an offense has a high percentile within Turnover Rate, that means it doesn’t turn the ball over often, whereas if a defense has a high percentile in Turnover Rate, it forces more turnovers. Or Tempo: If an offense has a high percentile in Tempo, then it runs fast, but if a defense has a high percentile in Tempo, it allows a fast game.
The idea is that if there is a gap between the two values within each stat, the color that fills that gap has the advantage in that dimension.