Week 1 Recap: FIU
Now that the dust has settled, let's take a deeper look at Indiana's matchup against FIU.
To kick off the first season under Curt Cignetti, Week 1 went nearly as well as it could have for the Hoosiers. While there were certainly some inconsistencies, it was a dominant performance by Indiana, and that should not be taken for granted.
If you missed the Bite-Sized Bison Gameday Roundup after the game, it discusses scenario-based EPA, cumulative EPA, and win probability, as well as more traditional stats and their respective top performers for each team. You can find it at the button below.
This Weekly Recap, though, is intended to dig deeper, laying out snap counts and PFF grades, but also with eyes on key concepts for this 2024 Indiana team, looking specifically at DL havoc, pass-catcher EPA, OL grades, and other things.
Indiana Offensive Snap Counts & Grades
Observations:
Elijah Sarratt received a pretty rough grade in his first game with Indiana. You’d probably need to dissect the tape to see why, but he recorded the most snaps in receiving situations (27) and was targeted 3 times. This seems like something we will see from this WR room, where some guys will receive a larger bulk than others for any given week. I don’t think this signals anything about his role moving forward.
What I do think signals something about future roles is Omar Cooper’s snap share. He played the second-most snaps in the room and seemed – based on substitutions – to eat a lot of Donaven McCulley’s snaps, even before McCulley was injured. That is definitely something to keep an eye on.
I was also surprised to see Myles Prices’ fairly small snap total. He recorded 22 receiving snaps and was targeted 6 times, meaning he was targeted once every 3.67 receiving snaps. He’s going to be vital this season.
Zach Horton has a near-monopoly on TE snaps, which was expected. Not only did he account for 44% of Indiana’s 2023 lead-TE’s receiving yards and catch a TD, he also recorded the 10th-most blocking snaps by an FBS TE, grading 28th in run-blocking and 9th (!!) offensively.
I was surprised that it was Ty Son Lawton leading the RB room the way he did, with an RB-leading 16 carries. It feels like a true committee, though, even with Elijah Green involved. Kaelon Black only had 2 snaps (very surprising) too. Like WRs, I anticipate this fluctuating by week.
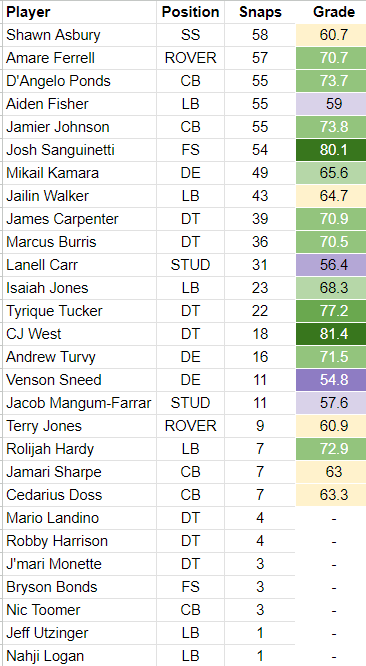
Indiana Defensive Snap Counts & Grades
Observations:
PFF grades can be harsh on LBs (as we saw with Aaron Casey last season), and that seems to be the case for Aiden Fisher, who was Indiana’s top defensive performer but earned a Defensive Grade just below average. This is credited to a couple missed tackles and allowing all 3 passes in his direction to be completed (for just 23 yards). I’m not alarmed by his grade.
For a defensive backfield with so many question marks, there seemed to be a solid corps at each of the five positions – D’Angelo Ponds and Jamier Johnson at CB, Josh Sanguinetti at FS, Shawn Asbury at SS, and Amare Ferrell at ROVER. Johnson was the best in coverage, allowing only 2 of his 6 targets to be completed; Ponds allowed 5 of his 7 targets to be completed but for only 33 yards; and they were all solid in run defense. Sanguinetti was graded as the 19th-best FBS safety this week.
Lanell Carr started and played the majority of STUD snaps, which is what we probably should have anticipated. Jacob Mangum-Farrar played 11 snaps and didn’t grade well. Carr didn’t grade well either. That spot will be intriguing moving forward because neither FIU is very good.
Isaiah Jones got into the game for quite some time, which is encouraging for him. Rolijah Hardy also got into the game, which I wasn’t expecting.
All DTs graded very well.
The following players recorded fewer snaps than I anticipated they would: CJ West, JMF, Terry Jones, Jamari Sharpe, Cedarius Doss, Nic Toomer, Bryson Bonds, Nahji Logan.
Big Ten EPA/play Comparison
EPA (Estimated Points Added) is the best existing metric for conveying a play’s value. I explain a bit in the Gameday Roundup how it works, and in the below graph, each Big Ten team’s EPA is split between offense and defense to show which teams are statistically better in each phase. USC is not included because this was created before their Sunday night game.
Observations:
Indiana is right where it wants to be at this point.
Laughing at Michigan State after its QB told the public to “take the over” in relation to how good the offense will be. The Spartans are last in the conference in offensive EPA.
None of the Big Ten teams have poor defensive EPAs, which is expected during Week 1, but three future Indiana opponents have negative offensive EPAs. That’s good news for Bryant Haines.
It’s just Week 1, but 6 of the bottom 7 offensive EPAs are future Indiana opponents.
Yikes, Oregon!
Surely, Iowa’s offensive EPA will come back down to earth.
Indiana Pass-Catcher EPA/target
The chart below conveys each Indiana pass-catchers EPA/target, which is not entirely a reflection of the receiver but more of a way to show the value of the plays when each receiver is targeted. This way, rather than accounting for a pass-catcher’s individual performance alone, it also accounts for offensive scheme and execution when that player is involved, creating an assessment of the offense’s success rather than simply the player’s.
Observations:
Being targeted one time definitely helps the EPA/target when considering just one game. Miles Cross and Justice Ellison, in particular, made massive catches when they were targeted.
Zach Horton notably had the highest EPA/target of those targeted multiple times. Scoring a touchdown will help that as well.
This chart will provide more insight as the season goes on.
Defensive Line Havoc
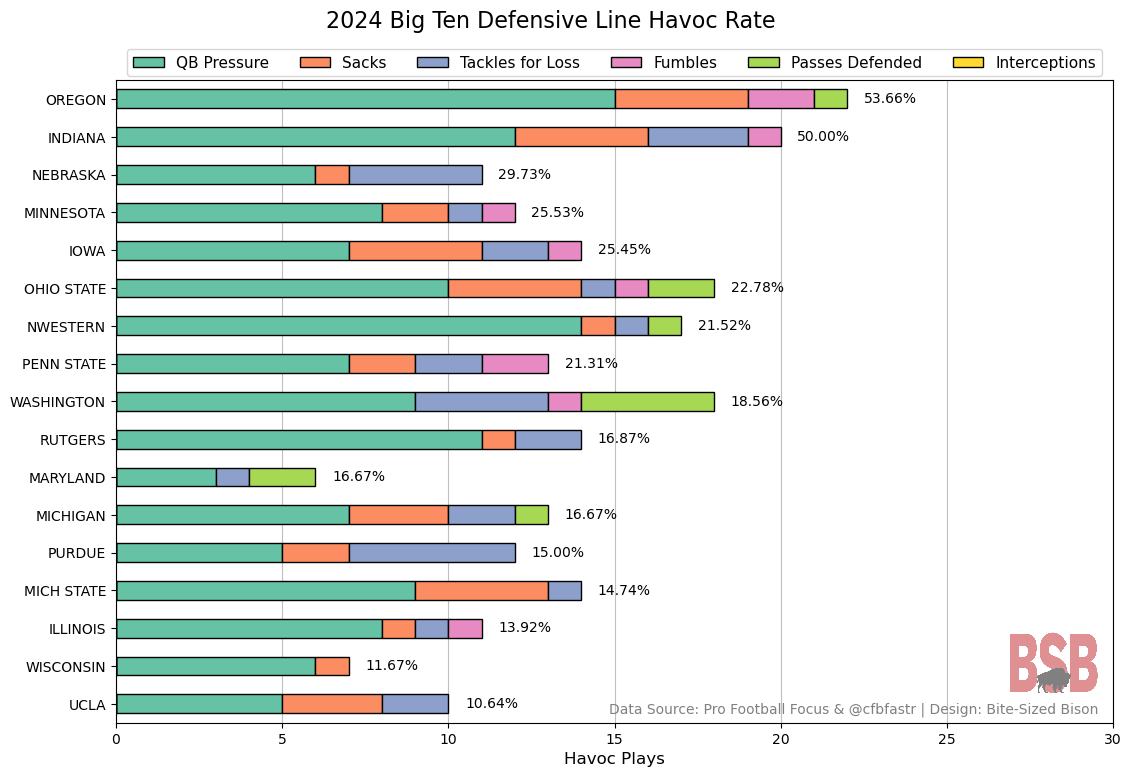
With this JMU staff coming to Indiana, there is going to be a major philosophical change on defense, charging the DL with creating havoc rather than just the LBs. I’ll put Indiana’s 2023 equivalent of the below chart at the bottom of this section for comparison, but the Hoosiers ranked second-to-last in DL havoc rate last year. Havoc is defined in different ways in different places, but I chose to include plays that involved QB hurries, QB hits, sacks, TFLs, forced/recovered fumbles, batted/deflected passes, and interceptions – basically any time a DL is negatively impacting the offense. The benefit of the below chart is that it disaggregates the different havoc plays to show not just the total number of havoc plays but also how that havoc is achieved. The chart is then sorted by havoc rate (the percentage of defensive plays that feature DL havoc).
Observations:
The strength of opponent always varies in non-conference games, but Indiana was second to Oregon in QB pressure (including sacks). I predicted in the BSB Chat that they would record 4+ sacks, and they got 4.
This type of havoc was anticipated, given the new philosophy and the weakness of the FIU OL (basically the worst in the FBS), but this is something to keep an eye on as the season progresses. It’s also refreshing to see, regardless and anticipation.
UCLA has fallen far further from its 2023 DL strength than I anticipated.
Indiana’s 2023 havoc rate is shown in the 2023 equivalent chart below.
Offensive Line Production
Assessing OL play is so subjective and (in many ways) unquantifiable, so I’ve chosen to lean on PFF grades. The below chart is simple – each Indiana OL’s season-long PFF Offensive Grade is listed next to the percentile he ranks within at his respective position (T, G, C) in the FBS.
Observations:
This is a small sample size, but Carter Smith is actually outpacing my initial expectation of him, while Trey Wedig was a bit less productive than I expected for Week 1.
The FIU DL is aggressive and likes to get downhill. Drew Evans and Bray Lynch held their ground fairly well.
This will continue to show production over time, somewhat like the EPA/target chart above.
After a micro look at OL production, I wanted to zoom out and compare to the rest of the Big Ten. The below chart filters all PFF OL grades to account for any OL that records at least 20% of the highest recorded blocking snaps and draws a line for each team from its minimum grade to its maximum. Each team’s logo is then placed at the average grade.
Notable Stats
Although Indiana’s pass protection looked a bit suspect in Week 1, three IU OLs (Carter Smith, Bray Lynch, and Mike Katic) are graded in the top-62 FBS OLs (1,068 qualified) in pass-blocking.
All Indiana OLs combined to average a ranking of 40th (out of 82) Big Ten OLs in run-blocking, which is a bit surprising, given how effective the blocking schemes were against FIU.
FIU LB Reggie Peterson, who lamented not receiving an Indiana offer in the Class of 2020 during a press conference leading up to the game, was graded last among all 396 FBS LBs to play 20+ snaps.
Former Hoosier DL Jeramy Passmore only played 27 snaps but graded well after recording one of 2 FIU sacks and a TFL.
FIU QB Keyone Jenkins graded 113th out of 133 qualifying FBS QBs.


The numbers back up what I think most fans are feeling: solid week 1 win with clear room for improvement in certain areas but no one thing overly glaring. These recaps are great.
Taylor, the defensive snap range was a bit surprising - looking at West, Sharpe, and Toomer - I didn't realize how stark the totals would be. Based on what we know about the Coach Haines and crew, what do you expect to see moving forward?