


IUMBB Preview: Oregon
A quick preview of Indiana Men's Basketball's next matchup against the Oregon Ducks


After winning four of its last five games — most recently a solid 78-62 win at Washington — Indiana, according to Bart Torvik, has increased its NCAA Tournament odds from 3% to 51%. The Hoosiers seem to have worked themselves toward the right side of the bubble with only two games left — tonight’s game at Oregon and Saturday’s game against Ohio State. These next two games will go a long way in terms of Big Ten Tournament seeding and avoiding a Wednesday matchup, as Oregon is most favored for the 8 seed and Ohio State most favored for the 10 seed — the seed Indiana wants to avoid — with IU sandwiched in between.
Delphi Bracketology currently projects Indiana at the 11 seed, separate from the Last Four In, which would be stellar for Indiana, and with a win tonight over Oregon (KenPom No. 33) to close out a West Coast trip, Indiana (KenPom No. 43) would almost certainly lock itself in position for the Tournament. The problem is that Oregon has steadied itself along with Indiana recently, winning its last five, including a win at Wisconsin last week. However, according to KenPom’s ratings, Indiana is the toughest opponent Oregon will have played during the stretch (outside of Wisconsin).
Part of this success is how Indiana has opened itself up, in terms of lineup rotations, not forcing personnel onto the floor without proven production. Immediately after BSB published the latest Bison Bites, which discussed the inefficiency of Ballo-Reneau-Mgbako on the floor at the same time, Oumar Ballo and Mackenzie Mgbako were removed from the starting lineup against Purdue (since returning but with fewer minutes, particularly fewer minutes with Reneau). Luke Goode has played 88% of available minutes in IU’s last five games. Anthony Leal played 34 minutes against Washington and recorded the highest +/- on the team without scoring a point. Malik Reneau has scored 86 points in 129 minutes (0.67 points per minute) in his last five games and has paired that with 3 assists per game. Indiana is just doing what works lately.
Observations
Indiana at Oregon:
Oregon is a very balanced team, between offense and defense, but also within its roster. There isn’t much particular firepower, but the consistency is the strength, as 9 Ducks have played (and averaged double-digit minutes) in at least 24 of Oregon’s 29 games.
The two areas Oregon excels within are limiting turnovers (86th in offensive turnover rate) and perimeter defense (58th in allowed 3-point percentage). Indiana has been consistent in forcing turnovers (10.9 in its last 10 games), and the Hoosiers have converted on 34% of threes in their last 10 games (50% in their last two games).
Defensively, TJ Bamba (top-50 in steal rate; 2 steals per game) and 7-foot center Nate Bittle (top-30 in block rate; 2.2 blocks per game) are the Ducks’ leading defenders. This could be disrupted by Indiana’s plethora of interior talent, where Oregon tends to surrender most of its opponents’ scoring.
Offensively, Oregon likes to stretch the floor, as Bittle attempts 3 threes per game as a 7-foot center, and it has one of the best-passing backcourts in the conference (all three starting guards average nearly 3 assists per game).
Oregon has moved more toward shooting threes as the season has progressed, as the Ducks have put up 20+ threes in each of its last 10 games. They’ve hit 46% of their threes in their last seven games, and they’ve converted double-digit threes three times in that span. Much of this production comes from starting guards Jackson Shelstead (40%) and Keeshawn Barthelemy (43%). Indiana must be strong on the perimeter.
Key
PPP = Points per possession — PPP is a reliable measure of efficiency on either side of the floor and is calculated as it’s named.
Tempo = Possessions per 40 minutes played — Tempo conveys how quickly a team plays on offense or how its defense is able to slow tempo
Effective FG% = FGs made + 0.5*3P FGs made / FGs attempted — Effective field goal percentage is much like field goal percentage but with a weight applied to threes to somewhat account for range
Points from FTs, Points from 2, Points from 3 = Total points from each range / Total points scored — This simply shows how many points are coming from each range for each team.
3-pt Rate = 3P FGs attempted / FGs attempted — This metric answers the question: What percentage of a team’s attempted shots are from three? Even shorter yet: How often does a team shoot threes?
3-pt% = 3P FGs made / 3P FGs attempted — This is the traditional three-point percentage metric.
Layup/Dunk% = Layup/Dunk FGs made / Layup/Dunk FGs attempted — A traditional field goal percentage for layups and dunks; How well does a team convert its closest shot attempts?
Free Throw Rate = FTs attempted / FGs attempted — Very similar to 3-pt Rate, free throw rate seeks to convey how often a team shoots free throws, which can show how well a team draws fouls.
Assist Rate = Assists / FGs attempted — Assist rate conveys how well a team moves the ball, particularly as it relates to creating shots.
Turnover Rate = Turnovers / Possessions — Turnover Rate simply shows which proportion of possessions end in turnovers for a specific team.
Block Rate = Blocks / Opponent FGs attempted — How many shots does a team block?
Off. Rebound% = Offensive Rebounds / missed FGs — How often is a team gathering its own missed shots?
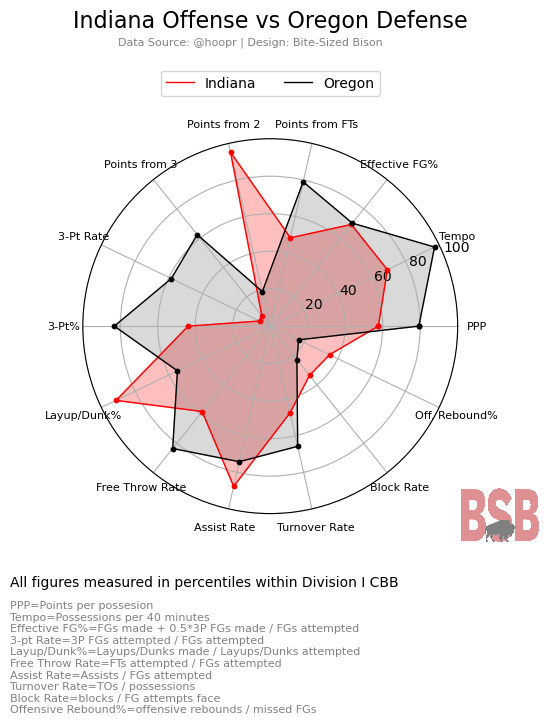
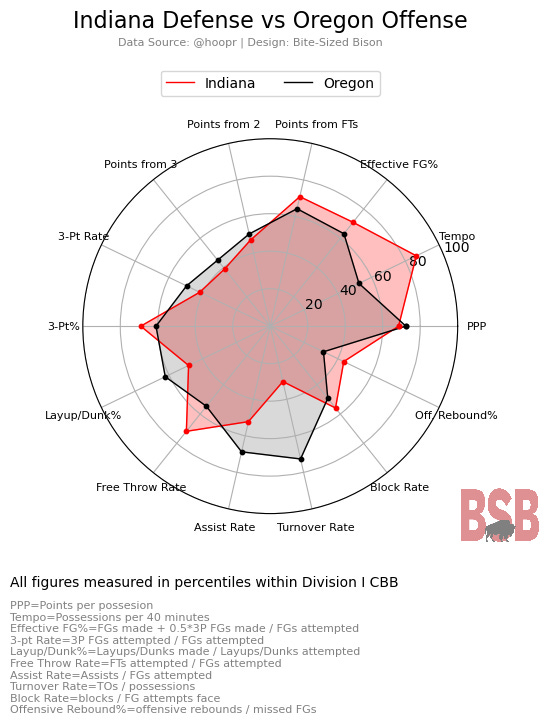
How to Read the Chart
Radar charts are super common in sports analytics, and if you’ve played sports video games, you’ve probably seen them before (typically in comparing the attributes of teams or players).
Each chart is intended to compare each side of the floor (IU’s offense vs. Opponent’s defense; IU’s defense vs. Opponent’s offense), and Indiana will always be red, while its opponent will always be black. The colored fill is intended to quickly show where an advantage/disadvantage is felt within each statistic.
For each stat, each team’s percentile within Division I college basketball is conveyed, which means the measure is in a pool of 300+ programs.
Some percentiles are fairly straightforward, such as 3-pt%; if an offense has a higher 3-pt% percentile, that means they make more of their threes than most D-I programs. But if a defense has a lower percentile within the same stat, it means it allows a better percentage of threes to be converted. Therefore, if there is a big gap between the two, then whoever makes a good amount of threes could have an advantage.
Some other stats are not as straightforward, such as Turnover Rate; if an offense has a high percentile within Turnover Rate, that means it doesn’t turn the ball over often, whereas if a defense has a high percentile in Turnover Rate, it forces more turnovers. Or Tempo: If an offense has a high percentile in Tempo, then it runs fast, but if a defense has a high percentile in Tempo, it allows a fast game.
The idea is that if there is a gap between the two values within each stat, the color that fills that gap has the advantage in that dimension.