


IUMBB Preview: Penn State
A quick preview of Indiana Men's Basketball's next matchup against the Penn State Nittany Lions


In a lot of ways, this Indiana teams feels like a different team with four games remaining. If you read the latest Bison Bites, I detailed how rough the trio of Oumar Ballo, Malik Reneau, and Mackenzie Mgbako have been when on the floor together, and, coincidentally, Mike Woodson began the game against Purdue with Ballo and Mgbako on the bench. Ballo played 22 minutes (to Reneau’s 24), and Mgbako played 9, while Indiana played some of the best basketball of the Woodson Era, holding Purdue to 21 second-half points (and 3 points in the third 10 minutes).
BartTorvik.com now gives Indiana a 27.6% chance to make the NCAA Tournament, up from 3.4% going into the Michigan State game two weeks ago, and EvanMiya.com lists Indiana’s resume as one of four considered Just Outside the Field. KenPom.com favors Indiana in three of its last four, which is significant because, not only does Indiana need to stack wins right now, but it also needs to avoid a Wednesday game in the Big Ten Tournament — a loss there would nearly guarantee missing the Tournament. On Reddit, the r/CollegeBasketball community keeps a running projection of Big Ten Tournament seeding, and currently, Indiana’s highest odds are the 10 seed (30.6%; meaning a Wednesday game) and second-highest odds are the 9 seed (23.1%; meaning no Wednesday game). The Hoosiers need to win their games and need Oregon, Illinois, Nebraska, and Ohio State to lose.
Even with all of this falling in Indiana’s favor, it’s still a stretch for Indiana to gain a Tournament bid, though. While Indiana is one of 13 teams in the top-60 (via NET) to have zero Quad 2 losses, the Hoosiers have 11 Quad 1 losses. There are four other teams in the top-60 with double-digit Quad 1 losses (Illinois, Baylor, Georgia, and North Carolina), and the last three are considered “Just in the Field” by EvanMiya.com. There’s a combination of factors at play for Indiana trailing these teams, and two of those factors are the five spectacular losses of 17+ points and the ensuing winnable games that ended in losses (Northwestern, Maryland, Purdue, Michigan, and UCLA), all in the last month. Just flip two of those, and Indiana might be ahead of those teams with double-digit Quad 1 losses in this conversation.
This is all likely for nothing if Indiana loses to Penn State on Wednesday in Bloomington. The last time Indiana played Penn State (at the Palestra on Jan. 5), the Hoosiers looked impressive, and the 77-71 win reignited many fans’ interest in the season, after three blowout losses defined the November-December stretch. Ballo and Mgbako combined for 45 points, and Luke Goode went 3-for-5 from three to spark his impressive 2025 play. Since that loss to Indiana, Penn State has gone 3-10 and fallen to 67th in KenPom’s rankings, after a strong start that featured a win over Purdue in December.
Observations
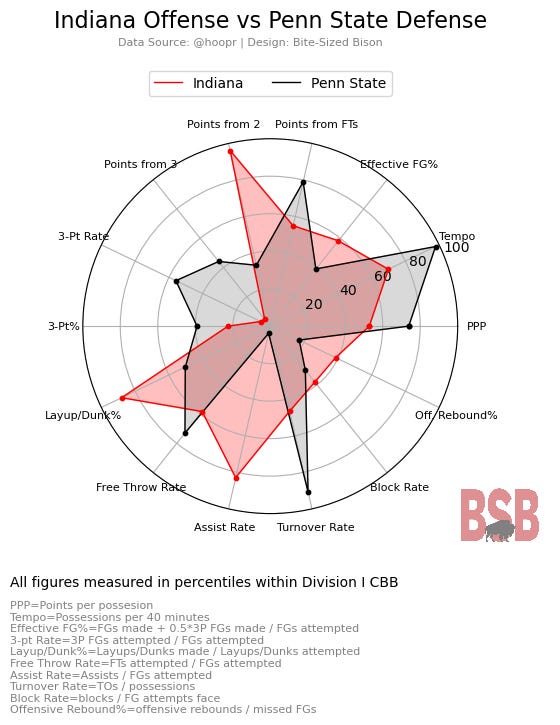
Indiana vs. Penn State:
Indiana should have an offensive advantage on the interior, but I’m curious how Woodson approaches Indiana’s frontcourt, after giving it primarily to Malik Reneau against Purdue, and successfully so. Oumar Ballo had 25 points and 13 rebounds against Penn State in Reneau’s absence back in January, but Reneau shot 7-for-7 with 6 rebounds and 4 assists against Purdue. That’s tough to ignore.
Mackenzie Mgbako scored 20 on Penn State in January, including 4-for-8 from three. I imagine he will see more than 9 minutes in this one because a team won’t get too far with just a six-man rotation, but Luke Goode may be the top option at wing for Indiana.
Related to the last point, while it may seem on the radar chart that Indiana won’t be able to shoot the three, Penn State actually isn’t impressive at perimeter defense, allowing a fairly abysmal 34.7% from three. Indiana took advantage of that in January, going 9-for-23 from behind the arc, and I’d anticipate it doing the same Wednesday.
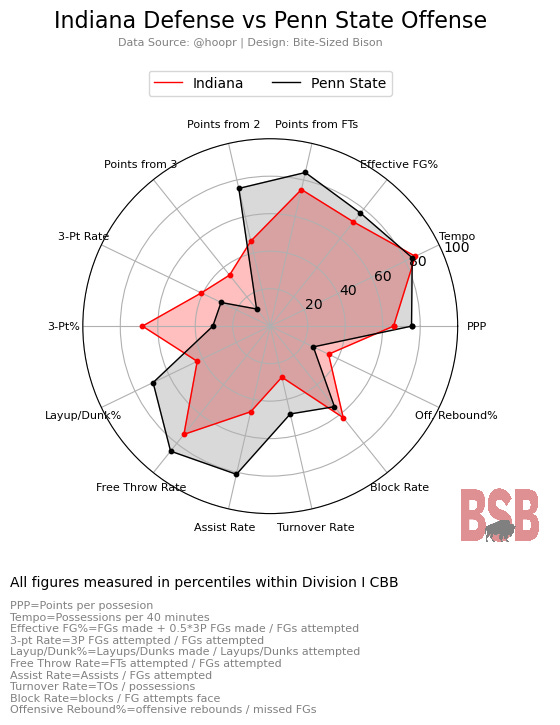
Penn State’s offense poses ingredients that Indiana has struggled with this season, such as a stretch forward who can shoot threes (Zach Hicks, 40% from three), cutting guards who mostly look to score inside (Nick Kern, 7-of-12 against IU in January; Freddie Dilione, 49.7% from two), and a scoring leader in the backcourt who can get hot (Ace Baldwin, 37.5% FG% and 7 assists per game). Even with many of these pieces clicking in January (save for Hicks’ threes), Indiana fought off Penn State. Much of this is likely due to Penn State’s limited ceiling in its strengths, but it must remain that way Wednesday.
Key
PPP = Points per possession — PPP is a reliable measure of efficiency on either side of the floor and is calculated as it’s named.
Tempo = Possessions per 40 minutes played — Tempo conveys how quickly a team plays on offense or how its defense is able to slow tempo
Effective FG% = FGs made + 0.5*3P FGs made / FGs attempted — Effective field goal percentage is much like field goal percentage but with a weight applied to threes to somewhat account for range
Points from FTs, Points from 2, Points from 3 = Total points from each range / Total points scored — This simply shows how many points are coming from each range for each team.
3-pt Rate = 3P FGs attempted / FGs attempted — This metric answers the question: What percentage of a team’s attempted shots are from three? Even shorter yet: How often does a team shoot threes?
3-pt% = 3P FGs made / 3P FGs attempted — This is the traditional three-point percentage metric.
Layup/Dunk% = Layup/Dunk FGs made / Layup/Dunk FGs attempted — A traditional field goal percentage for layups and dunks; How well does a team convert its closest shot attempts?
Free Throw Rate = FTs attempted / FGs attempted — Very similar to 3-pt Rate, free throw rate seeks to convey how often a team shoots free throws, which can show how well a team draws fouls.
Assist Rate = Assists / FGs attempted — Assist rate conveys how well a team moves the ball, particularly as it relates to creating shots.
Turnover Rate = Turnovers / Possessions — Turnover Rate simply shows which proportion of possessions end in turnovers for a specific team.
Block Rate = Blocks / Opponent FGs attempted — How many shots does a team block?
Off. Rebound% = Offensive Rebounds / missed FGs — How often is a team gathering its own missed shots?
How to Read the Chart
Radar charts are super common in sports analytics, and if you’ve played sports video games, you’ve probably seen them before (typically in comparing the attributes of teams or players).
Each chart is intended to compare each side of the floor (IU’s offense vs. Opponent’s defense; IU’s defense vs. Opponent’s offense), and Indiana will always be red, while its opponent will always be black. The colored fill is intended to quickly show where an advantage/disadvantage is felt within each statistic.
For each stat, each team’s percentile within Division I college basketball is conveyed, which means the measure is in a pool of 300+ programs.
Some percentiles are fairly straightforward, such as 3-pt%; if an offense has a higher 3-pt% percentile, that means they make more of their threes than most D-I programs. But if a defense has a lower percentile within the same stat, it means it allows a better percentage of threes to be converted. Therefore, if there is a big gap between the two, then whoever makes a good amount of threes could have an advantage.
Some other stats are not as straightforward, such as Turnover Rate; if an offense has a high percentile within Turnover Rate, that means it doesn’t turn the ball over often, whereas if a defense has a high percentile in Turnover Rate, it forces more turnovers. Or Tempo: If an offense has a high percentile in Tempo, then it runs fast, but if a defense has a high percentile in Tempo, it allows a fast game.
The idea is that if there is a gap between the two values within each stat, the color that fills that gap has the advantage in that dimension.
I think we're in the territory of every remaining game being an elimination game from tournament consideration. Maybe a road loss to Oregon is survivable, but none of the others are.