

Week 13 Recap: Ohio State
Now that the dust has settled, let's take a deeper look at Indiana's matchup against Ohio State.

Like Curt Cignetti said as he sat down for his postgame press conference Saturday, “all things come to an end eventually,” as Indiana earned its first loss of the season, 38-15, against Ohio State. The particularly difficult reality about this game for Indiana fans is that it didn’t seem like Indiana met Ohio State with full force. Ohio State absolutely influenced Indiana with its talent and scheme and was the better team, no doubt at all; the postgame win expectancy for Indiana was 0.1%. It was more than just the special teams mistakes and the false start penalty. However, anyone who’s watched this Indiana team play week-in and week-out knows Indiana had more to show than it did Saturday. The special teams mistakes, the lack of response from the offensive staff, and the mismanaged environment were all self-imposed limitations by this team, and it was uncharacteristic.
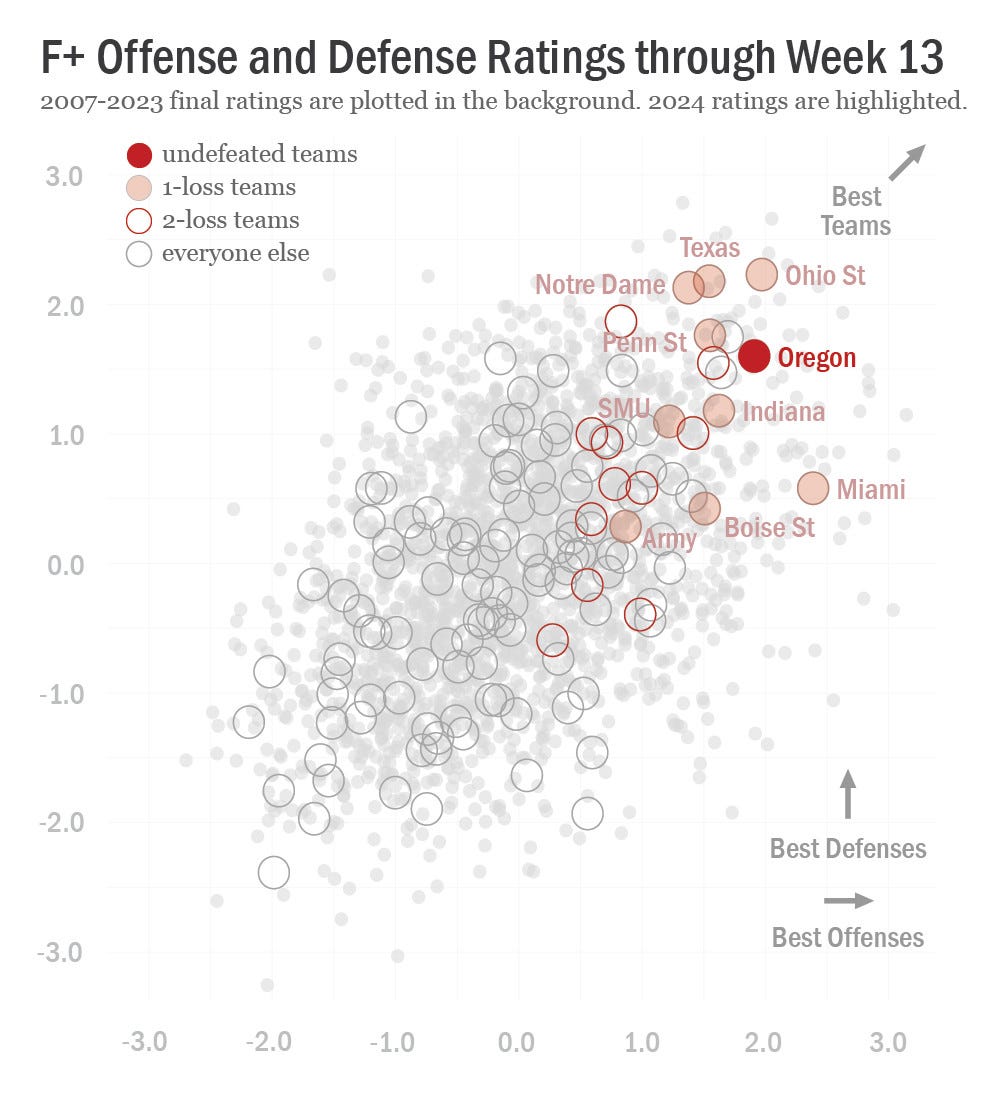
At the same time, there was an increased level of expectation applied to this game than anyone had going into this season — or even had before November, when CFP rankings were first released. At this point, Indiana sympathizers are building the Hoosiers’ case for the College Football Playoff in the face of some bad-intentioned punditry, and it left much more riding on this game than expected, or than was even fair to Indiana. I’ll link this post from On3’s Ari Wasserman again; expecting Indiana to go into Ohio Stadium, where Ohio State had lost four times in the last decade, and beat what is shaping up to be one of the best teams in the last 17 seasons (see the chart below from Brian Fremeau at bcftoys.com) is an insane one-game Litmus test.
Joel Klatt does good job here laying out why Indiana remains a logical shoe-in for the College Football Playoff, as long as it takes care of business against Purdue.
The loss to Ohio State certainly takes some wind out of this season’s sails, but it doesn’t change much in our understanding of this Indiana team. It is still the team that’s dominated it’s schedule (5th in average scoring margin against FBS teams), holds steady at 11th in FPI, owns the 5th-best CFP odds (97.4%), has the seventh-best strength of record, and is one of the most efficient teams in the nation. We now simply have a better understanding of its vulnerabilities, which frankly hadn’t really been shown or exploited to this point.
This Indiana team is not done yet.
Inside this BSB weekly recap:
Ohio State’s Defensive Pressure
Offense and Defense Snap Counts and PFF Grades
Indiana Cumulative EPA Tracker, Offense and Defense
Big Ten EPA/play Comparison
Big Ten QB Comparison Chart
Big Ten WR EPA/target Chart & Indiana Pass-Catcher Comparison Chart
Big Ten DL Havoc Chart
Big Ten OL PFF Grades Distribution
If you missed the Bite-Sized Bison Gameday Roundup after the game, it discusses scenario-based EPA, cumulative EPA, and win probability, as well as more traditional stats and their respective top performers for each team. You can find it at the button below.
Ohio State’s Defensive Pressure
Indiana’s passing game has been the source of confidence for Indiana Football this season, and rightfully so. Kurtis Rourke was leading the Big Ten in EPA/play entering the Ohio State game and was third in the nation when adjusted for opponent (via CFBNumbers). The Hoosiers were leading the country in passing success rate as well. However, a recent trend has stunned passing production for Indiana, and it is concerning.
Indiana has passed for just 84 yards in its last six quarters. This is a direct result of passing pressure from opponents. In the nine games leading up to Michigan, Rourke was pressured on just 20.7% of dropbacks (2nd in B1G). Since then — against Michigan and Ohio State — his pressured rate is 31.3%. What makes this pressure seem even more substantial is that Rourke leads the Big Ten (7th in FBS) with a 40% pressure-to-sack rate during that span, meaning the increased pressure is doing more than blowing up passing plays; it’s also leading to sacks. This was particularly bad against Ohio State, who surprisingly only produced enough pressure on 7 plays to be considered QB pressures by PFF, but 5 of those pressures led to sacks, 4 via blitz. According to PFF, Rourke was only blitzed on 9 dropbacks (39.1%), which is comparable to his season-long 38.3%, but it seemed like the Buckeyes were blitzing more often because of their stunt actions with their DEs and the speed with which they ran them.
Ohio State’s defense is certifiably insane. It allows the fewest points per game (10.7) and the fewest yards per game (241.7) in the nation, and it leads many of the metrics you’ll see below. There were absolutely vulnerabilities at CB and in run defense, but the Buckeyes were able to sustain those, and Indiana got away from exploiting them at times. The one area where Ohio State had been disappointing on defense for most of the season was its DL, which was outlined in the Preview and can be seen in the graphic below.
But the Buckeyes and their DC Jim Knowles have been working on scheme over the last few weeks to correct this, particularly calling for LB blitzes and using their DTs to free up their DEs on stunts (seen below) in schemed pass rush. They deployed these concepts after Indiana’s first offensive drive, when it became clear Knowles was testing the strength of the Indiana OL in one-on-one, base defense cases. The rest of the game was just Ohio State showcasing to the nation the improvements it’s made in this area of the defense. It was extremely impressive.
Indiana OC Mike Shanahan had few answers for it. What made it extremely difficult to counter mid-game was the disguising. Shanahan, Rourke, and Tino Sunseri had (and picked up) nearly zero cues pre-snap, and the environment didn’t help, as the offense needed to move to a silent count for snaps because Mike Katic couldn’t hear. This also influences what can be communicated in pass protection, of course. However, this pre-dates the Ohio State game too.
In this video: On this play, you can see Ohio State DE Jack Sawyer (33) soar around from the edge, stunting around his DT and LB, and go unblocked to Rourke. The reason this play works is because of speed and disguise. Before the snap, Ohio State’s LBs are feigning blitz, stepping back, and moving to entirely different gaps just before Rourke snaps. When he snaps, the OL has no clue what is coming. The DE over Carter Smith at LT charges and then backs out, which leaves Smith taking Tyler Stephens’ man and Stephens, confused because he thought the DE was coming in, blocking no one. Meanwhile, Sawyer flies by through the gap that his LB just cleared out by taking Mike Katic toward the right side.
One way a team can counter blitzes, particularly disguised blitzes, is by using the aggressive scheme to open up rushing lanes, and to Shanahan’s credit, Indiana ran well and ran 36 designed runs for 128 yards (which outpaced Ohio State’s 125). In the postgame press conference, Curt Cignetti seemed to want more rushing in retrospect, which would make sense given the figures in the chart below.

Another method to counter blitzing is by attacking with a short-passing game — screens, slants, out-routes, designed RB passes — to force the defense back a bit. That didn’t appear to be in the cards for Indiana on Saturday, for whatever reason. To be fair, it really hasn’t been (in bulk) all season, unless the Hoosiers are near the endzone. Look at this beautifully designed slant combo that drew a flag:
In the unaffected weeks before the Michigan game, Kurtis Rourke averaged 10.3 yards per target (18th nationally and 4th in the Big Ten). In attempt rate of 0-9 yards downfield all season, Rourke is 72nd nationally (12th in Big Ten), meaning he isn’t throwing short very often. In the last three weeks (including the Michigan and Ohio State games), Rourke is 40th nationally (8th in Big Ten) in attempt rate 0-9 yards downfield. So there has been some short-game response to the pressure, just in small, ineffective doses. But the issue is that Indiana’s plays have simply been too slow-developing. Even in that short range (0-9 yards downfield), PFF has Rourke clocked slower against Michigan and Ohio State (2.33 seconds to throw) than in the weeks prior (2.13).
Ohio State recognized this with Indiana’s offense and prioritized speed. Speed was something Cignetti noted specifically in the press conference too. If it could get into the backfield quick enough or stunt Indiana’s OL scheme on RPOs, it could leave the offense with just a knife in a gunfight. Just watch the play below.
In this video: Bray Lynch (RG) is supposed to pull and block that edge on the left side of the defense, but he’s just (understandably) too slow. That’s a 5-star DE coming in hot. Indiana has been running actions like that all season; it’s actually been a cornerstone of the offense, whether it’s a pulling guard, a TE, or even a WR (Miles Cross often does this). It’s fairly common in a modern RPO offense. There was no way that action was working against Ohio State’s speed. And when Lynch missed, it was just Justice Ellison left in pass protection, and it wouldn’t have mattered anyway, because on the other side, TE Zach Horton was being eaten up by Jack Sawyer (again, a 5-star DE). This was with Ohio State only rushing four!
In this video: This play was the result of a combination of things: 1.) Ohio State was disguising pressure all game, so Rourke had no clue who was coming (see the defense’s look on the replay), 2.) the play needed some distance (3rd and 8) but was also slow-developing (Price was met physically by a defender and hadn’t even cut yet when Rourke needed to throw), and 3.) the speed from Ohio State.
In terms of overall speed, Rourke releases the ball in a fairly average amount of time, ranked 72nd nationally in time to throw (2.54 seconds), but much of that is rooted in his 10-to-19-yard targets, where he ranks 12th nationally in attempt rate and 12th nationally in fastest time to throw (2.64 seconds) — also graded 10th nationally as a passer in this range by PFF. He gets the ball out very quickly and very often deeper down the field, which sets up his talented WRs to make plays downfield, but it’s all based in scheme.
Those intermediate passes are a bit easier for more talented defenses to defend (as shown against Michigan), and much of Indiana’s offensive scheme relies on setting precedent and then breaking it later in the game. When that precedent can’t be established and/or it’s not Indiana dictating the speed of the play, the Hoosiers struggle. Something I’ve been endlessly impressed by from Shanahan is his ability to reach deep into his bag mid-game, especially in counter to a team’s defensive strategy. Previous Indiana offenses maybe could go half a standard deviation away from their initial gameplans, but Shanahan can go 1, 1.5, or even 2 deviations away from the gameplan. This one required more than he was able to reach — partially because there was limited communication between Rourke and his OL — and left the OL (and Rourke) in very difficult positions until the offense was no longer recognizable.
There is clearly a formula to attack this Indiana offense — beginning with stunting the intermediate passing game and compounded with well-schemed blitzing (particularly with loads of talent on the DL) and speed — and the offensive staff must adapt before the College Football Playoff.
Indiana Offensive Snap Counts & Grades
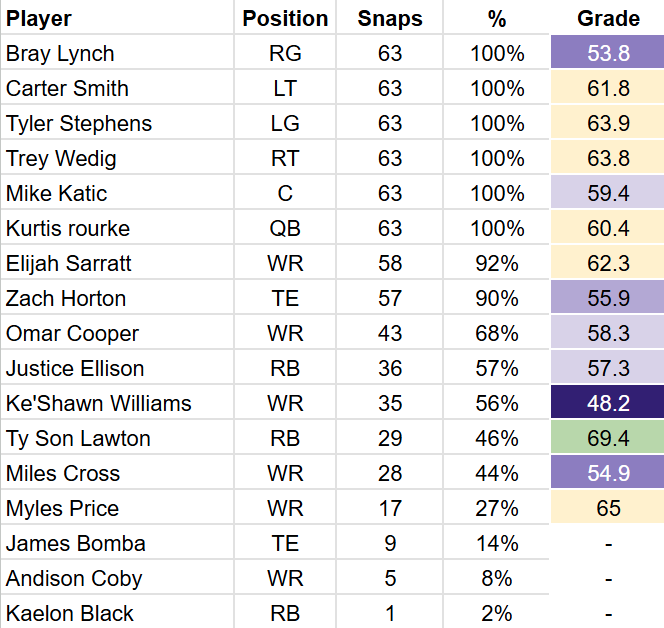
Observations:
The slot WRs, Myles Price and Ke’Shawn Williams, seemed to be primed for bigger days than they had, given the way previous teams had attacked this Ohio State defense. They were each targeted 3 times and combined for 3 catches and 19 yards. It seemed as if there could’ve been more drawn up for those two in quick-passing concepts, but it just didn’t happen.
Elijah Sarratt has really come back to Earth in the last four games. He was solid against a poor Michigan State defense (4 catches, 59 yards, 2 TDs), but in the three other games (Washington, Michigan, Ohio State), he’s totaled 5 catches on 15 targets (3 drops) for 88 yards and the TD on the nice ball from Kurtis Rourke against Michigan. Sarratt is talented, but this is concerning.
Another indication that the offensive staff struggled to put its blockers in optimal position is that Zach Horton posted, by far, his worst grade in pass blocking. He’s not often in pass-blocking scenarios, just 4 on Saturday, but he’s always effective. Not when he’s matched up against 5-star DEs, though.
Ty Son Lawton has been quietly (to the casual fan) very effective. The Maryland game in Week 5 marked the point when Lawton began to be trusted with a heavier load. He carried the ball 19 times that game and has averaged roughly 12 carries per game since. In the seven games since that week, he has recorded the 8th-best rushing grade in the Big Ten, averaged 5.1 yards per carry (10th in B1G), ran for 16 first down s(4th in B1G), and has been targeted 8 times (8th in B1G). Lawton has legitimately been a top-10 Big Ten RB. Against OSU, he carried the ball 15 times for 79 yards (5.3 average) and added 2 TDs.
Indiana Defensive Snap Counts & Grades
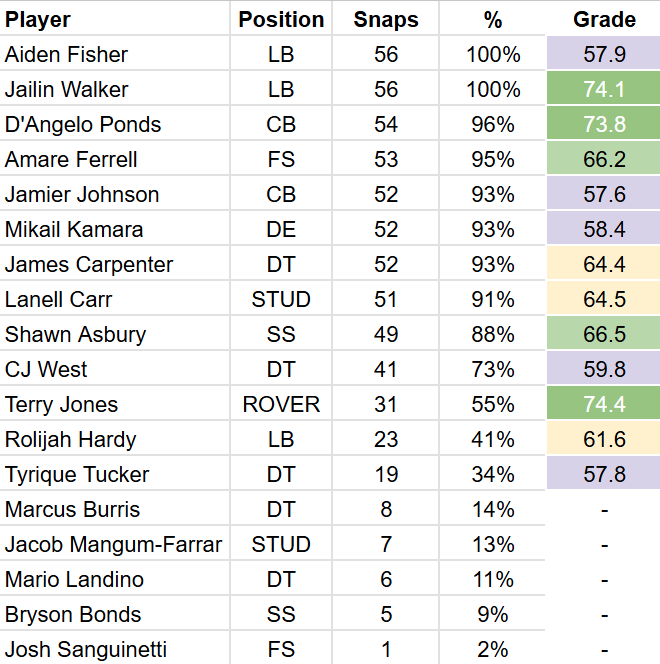
Observations:
Indiana relied pretty heavily on its starters on the defensive side, as 10 defenders played for at least 88% of the team’s snaps. Only CJ West and Terry Jones played fewer. Asking a DT like West to play more than what he played would be tough, and Jones came off the field for three-LB sets, which called on Rolijah Hardy, who got some big snaps Saturday.
PFF actually did not like Ohio State’s OL play that much. They did get really effective grades in pass blocking (as noted above), but in run blocking, the Buckeyes were not good and posted their worst grade of the season. This had a lot to do with the way Indiana deployed its second-level defenders. Indiana’s top-5 run-defense grades went to Lanell Carr, Jailin Walker, Amare Ferrell, Terry Jones, and Rolijah Hardy. Bryant Haines had Carr playing heavier on the LB side of the DE-LB hybrid role he plays at Stud DE, while also including several three-LB sets with Hardy. Haines ensured there was a stronger mid-level presence than just the two LBs, and it really worked in limiting Ohio State’s rushing success. The Buckeyes totaled just 115 rushing yards (their 2nd-lowest this season) as well as 4.0 yards per carry (also 2nd-lowest). If you take out the 39-yard carry at the end of the game, Ohio State totaled just 76 yards (2.7 yards per carry).
James Carpenter playing 91% of snaps at DT against Ohio State is insane. He’s tied for 49th among FBS DTs in snaps played, after playing 800+ in 2023 and 600+ in 2022. He’s played more than 2,400 snaps in his career. That’s unbelievable. He also led the team in QB pressures against OSU.
Mikail Kamara had a rough day. He ended the game with 0 QB pressures after entering the game leading the FBS.
Jailin Walker had a big day. His athleticism really showed against a tough team. He had the interception, led the team in tackles and individual stops, and only allowed 5 yards on two allowed catches.
Lanell Carr, according to PFF, only played 8 coverage snaps, though it felt like more. He’s dropped back in coverage plenty this season, with a season-high 19 coverage snaps against Maryland, which isn’t entirely surprising because of his previous experience as a LB at West Virginia. His receivers had only been targeted 10 times before Saturday. That changed against Ohio State. The Buckeyes saw him in coverage and targeted his man on half of his coverage snaps. Carr surrendered 4 catches on 4 targets for 57 of Ohio State’s 201 passing yards and 1 of the 2 passing TDs.
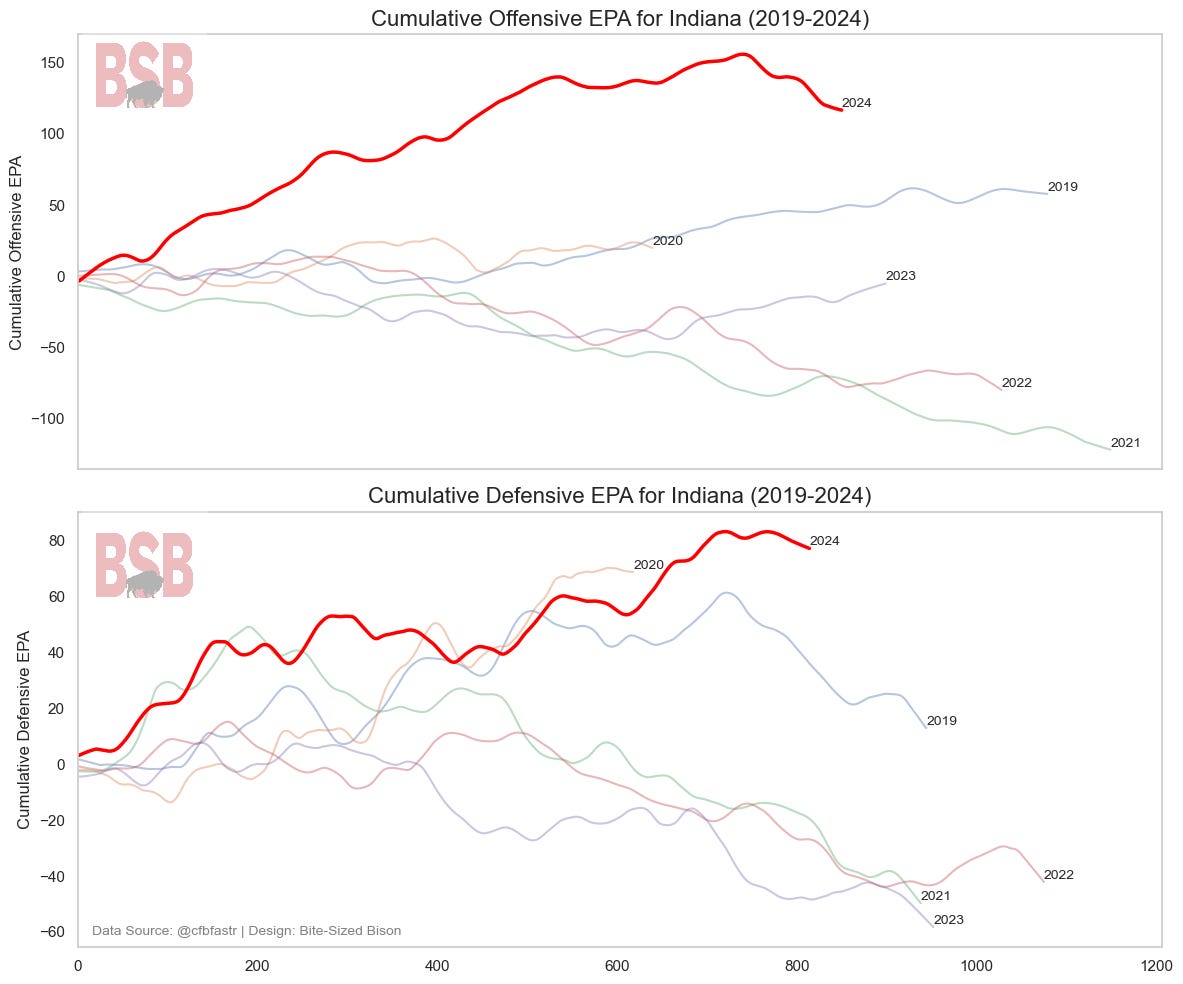
Indiana Cumulative EPA Comparison, Offense and Defense
Indiana was a drastically different team in any of the five seasons between 2019 and 2023, and 2024 is expected to be even more so. Comparing 2024 offensive and defensive cumulative EPA to the previous five seasons can offer some insight into how the season is progressing in relation to recent years.
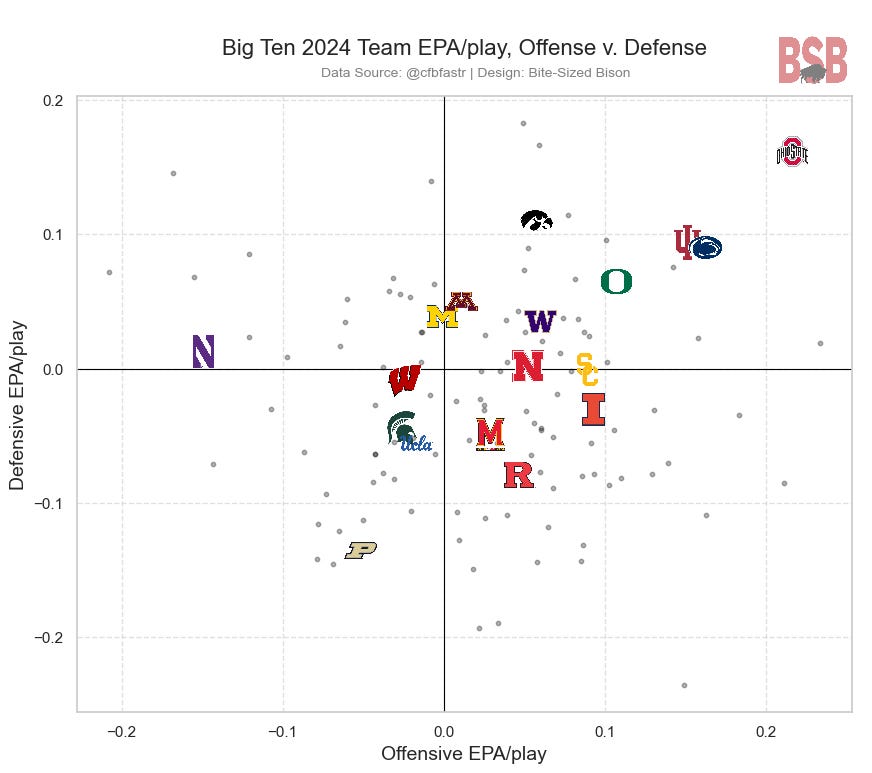
Big Ten EPA/play Comparison
EPA (Estimated Points Added) is the best existing metric for conveying a play’s value. I explain a bit in the Gameday Roundup how it works, and in the below graph, each Big Ten team’s EPA is split between offense and defense to show which teams are statistically better in each phase.
Big Ten QB Comparison
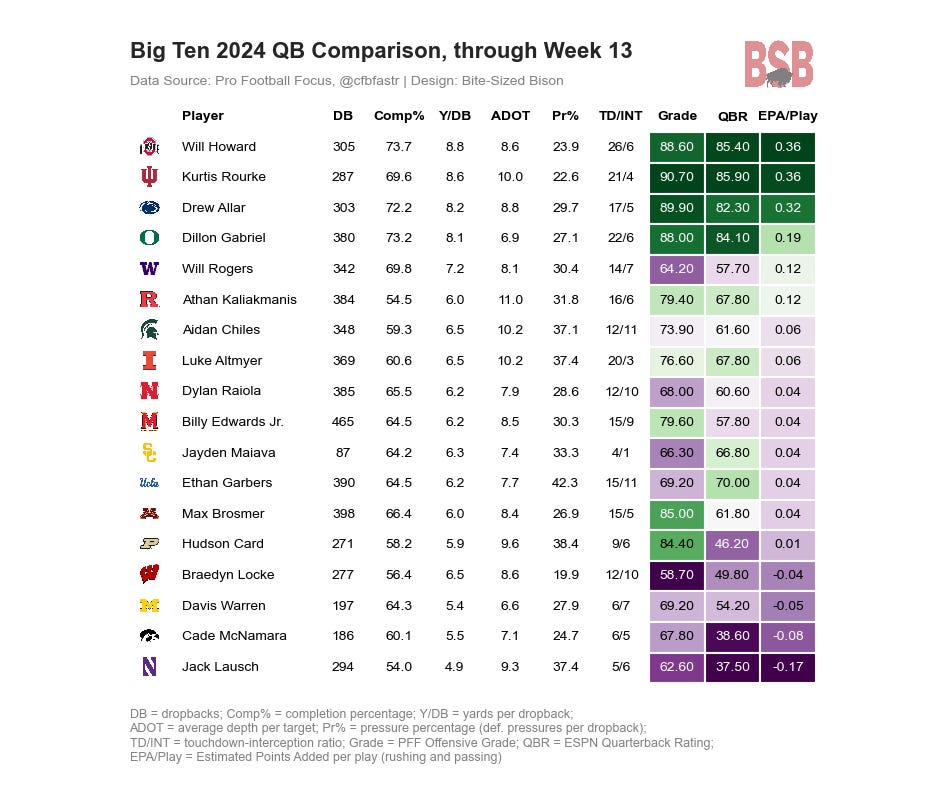
Observations:
Will Howard had a decent game in that he didn’t make many mistakes. His EPA/play figure stayed fairly still. So did his QBR. Kurtis Rourke’s plummeted, and now there’s a new leader in QB EPA/play in the conference.
Aidan Chiles is now at the top of what has become a pretty ugly mid-off among the QBs in this conference.
Big Ten Pass-Catcher EPA/target
The chart below conveys each Big Ten WR’s EPA/target, which is not entirely a reflection of the receiver but more of a way to show the value of the plays when each receiver is targeted. This way, rather than accounting for a pass-catcher’s individual performance alone, it also accounts for offensive scheme and execution when that player is involved, creating an assessment of the offense’s success rather than simply the player’s.

Observations:
Indiana WRs are beginning to fall into line on this chart after a couple rough games. Elijah Sarratt is in good company, with OSU WR Jeremiah Smith and Illinois WR Pat Bryant, but it’s as a result of the regression of the Indiana passing game.
Miles Cross has all but disappeared in this passing offense. He’s caught one pass in the last four games (five weeks) and wasn’t targeted at all in his 28 snaps against Ohio State.
Indiana Pass-Catchers
Pro Football Focus ranked Indiana’s WR room as the best at the position after Week 6. The chart below shows various metrics for each pass-catcher in Indiana’s offense, sorted by total Win Probability Added to Indiana’s games.
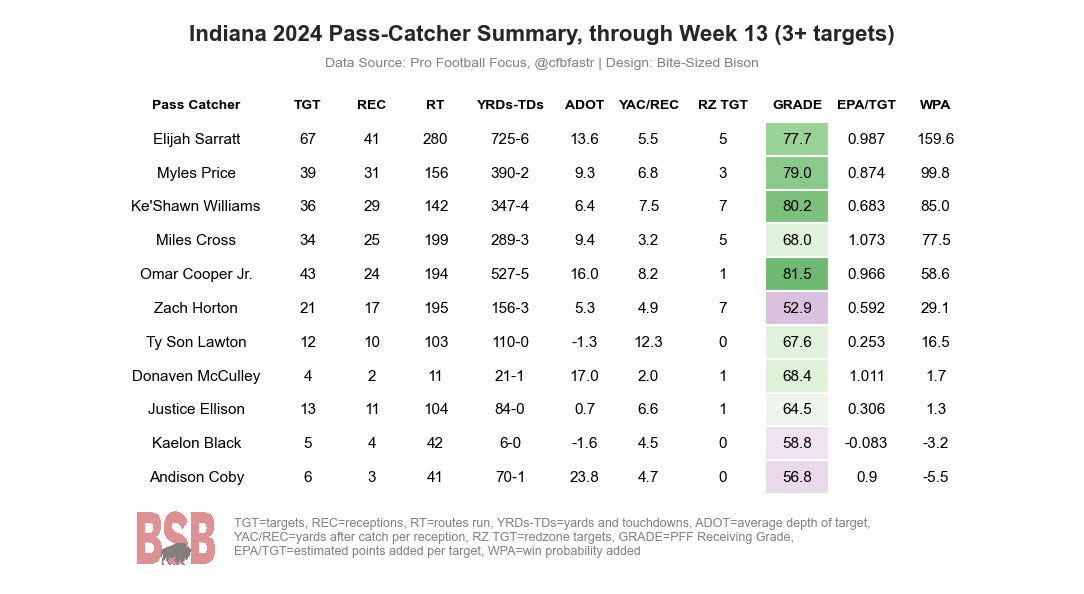
Observations:
This offense seems built to run a short passing game. Looking at this pass-catcher chart with the understanding that Indiana couldn’t get into its short passing game against Ohio State is baffling.
Zach Horton is ranked 7th in the Big Ten as a run-blocking TE (17th in FBS as pass blocker). He’s most effective in that role, but I can’t help but feel like he’s more valuable than his 5 targets in the last four games. He wasn’t targeted at all against Ohio State (for many reasons).
Defensive Line Havoc
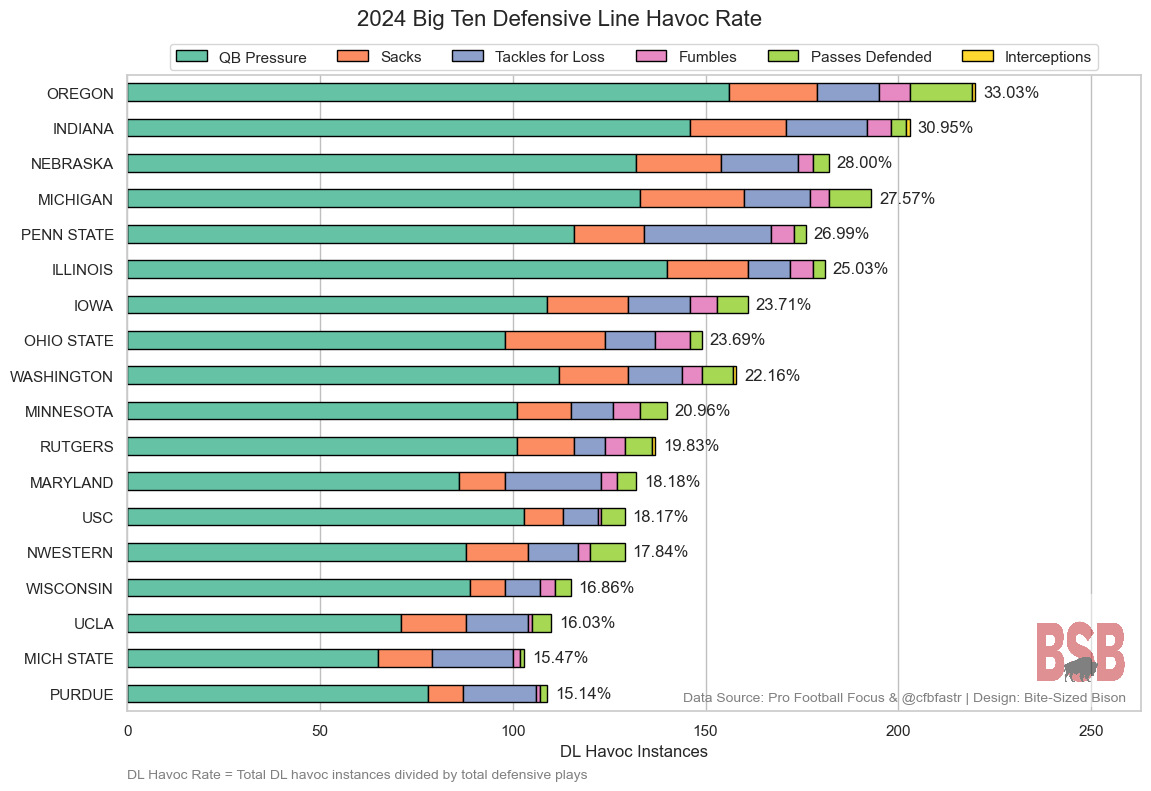
With this JMU staff coming to Indiana, there has been a major philosophical change on defense, charging the DL with creating havoc rather than just the LBs. The Hoosiers ranked second-to-last in DL havoc rate in 2023. Havoc is defined in different ways in different places, but I chose to include plays that involved QB hurries, QB hits, sacks, TFLs, forced/recovered fumbles, batted/deflected passes, and interceptions – basically any time a DL is negatively impacting the offense. The benefit of the below chart is that it disaggregates the different havoc plays to show not just the total number of havoc plays but also how that havoc is achieved. The chart is then sorted by DL havoc rate (the percentage of defensive plays that feature DL havoc).

Observations:
Indiana’s DL wasn’t bad against Ohio State, and criticizing the defense at all after this game seems off-target, but the DL could’ve been better. Four of Ohio State’s starting OLs posted pass-blocking grades in the top-half of the Big Ten this week. When 31% of your defense’s havoc comes from the DL, that must be more influential, especially against an OL unit in as much upheaval as OSU’s. The Hoosiers posted their worst pass-rush grade from PFF this week.
This chart really shows the quality of the recent improvement Jim Knowles has made to that DL.
Purdue gets the lowest percentage of its defensive havoc from its DL, which should be a welcomed task by this Indiana OL that’s played some pretty tough defensive fronts in the last four weeks (Washington, Michigan, Ohio State).
Offensive Line Production
After a micro look at OL production, I want to zoom out and compare to the rest of the Big Ten. The below chart filters all PFF OL grades to account for any OL that records at least 20% of the highest recorded blocking snaps and draws a line for each team from its minimum grade to its maximum. Each team’s logo is then placed at the average grade.
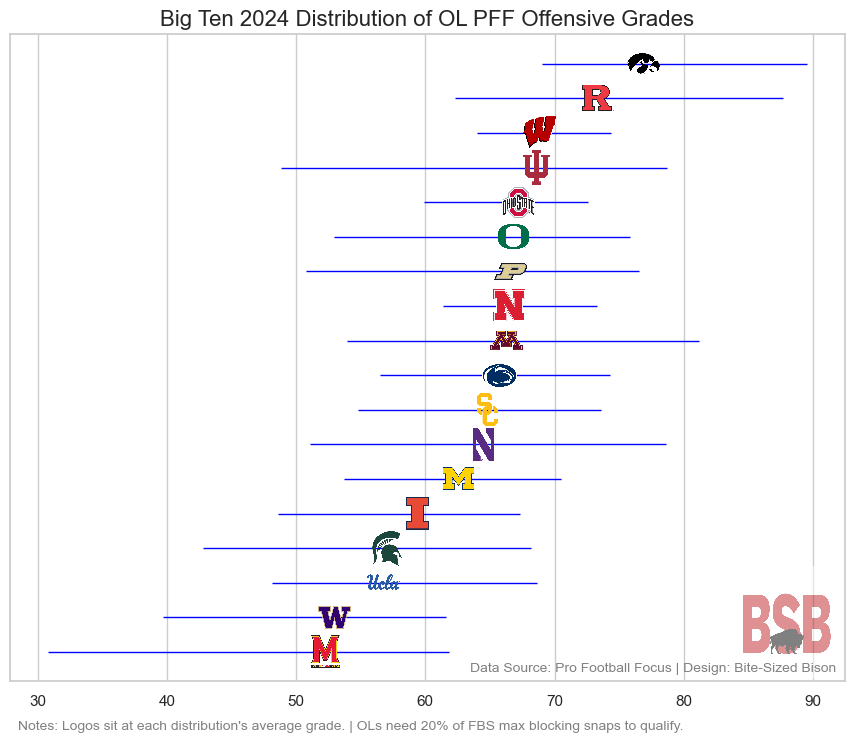
Observations:
It seems odd that Indiana’s OL grade would jump Ohio State’s after that game, but PFF was fairly forgiving in grading Indiana’s OL. They simply weren’t positioned to make plays in pass protection. The grades weren’t glowing — four Indiana OLs graded between 56th and 68th among Big Ten starting OLs for pass-blocking this week — but they weren’t lowly.
Tyler Stephens, who recorded the best OL grade for Indiana, also boosted the minimum by quite a bit, so that helps the average grade. It seems Stephens’ pas-blocking grade (which was very favorable) was likely because he just happened to not be isolated as much as the other OLs.
Ohio State’s run-blocking woes (noted in the snap counts section) really hurt the Buckeyes’ grades this week.
Walking away from this graphic might have many folks unconvinced that Indiana’s OL is graded 4th in the Big Ten, which is fair. However, there is reason to believe that its performance against Michigan and Ohio State was a compounding of variables it hadn’t experienced yet this season — the talent on Michigan’s DL, the scheme (and talent, of course) on Ohio State’s DL, and the environment of Ohio Stadium. There hasn’t been much on tape that convinces me the drop-off from Drew Evans to Tyler Stephens at LG is that significant, and these can be interpreted as learning experiences by this staff. Regardless, the OL has something to prove against Purdue, a weak defensive front, in what is expected to be a very cold game. The OL likely isn’t actually 4th-best in the conference, but it’s also not as poor as it’s looked in the last couple of games either.
Post game thoughts…. I U is vastly improved from any time in its past. IU is one of the better teams around. Yet There’s a chasm between them and OSU. 4 games ago I thought Sarratt was potentially ONE OF IU’s all time receivers. He may yet be but his play has diminished in recent games. The OL has been effective vs everyone who is not elite level. Since HS recruiting has pretty much ended, it will be interesting to see what positions are prioritized in the portal.