

Week 7 Recap: Bye Week 1
Now that the dust has settled, let's take a deeper look at the numbers after Indiana's first bye week.

After a historic 6-0 run to get to its first bye week, Indiana exits the bye with the meatiest part of its schedule ahead — vs. Nebraska, vs. Washington, at Michigan State, and vs. Michigan — before its second bye. While the Hoosiers are favored by ESPN FPI in each of these matchups, there is a definite increase in quality of opponent.
If you missed the most recent Bite-Sized Bison Recap after the Northwestern weekend, you can find it at the button below.
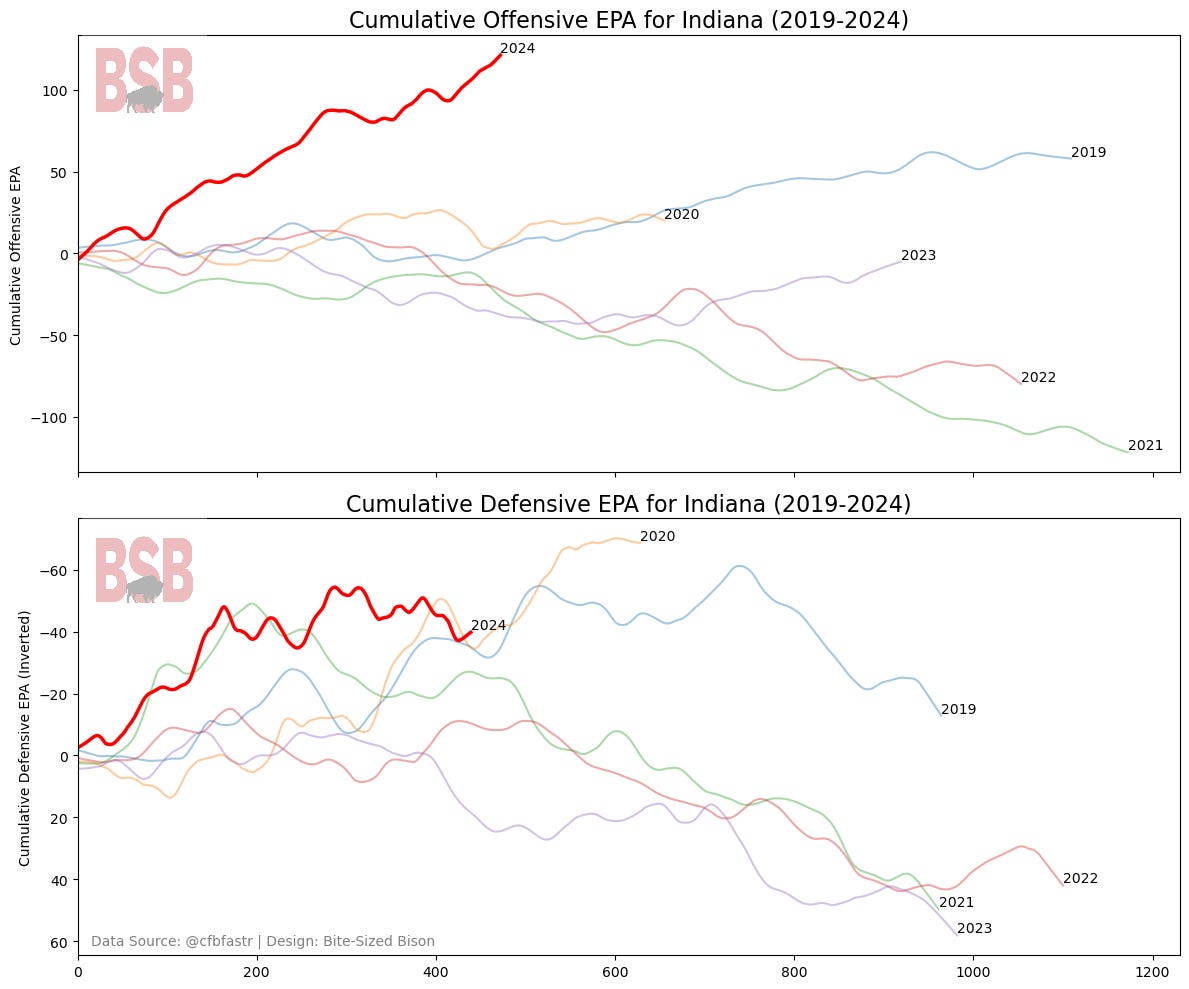
Indiana Cumulative EPA Comparison, Offense and Defense
Indiana was a drastically different team in any of the five seasons between 2019 and 2023, and 2024 is expected to be even more so. Comparing 2024 offensive and defensive cumulative EPA to the previous five seasons can offer some insight into how the season is progressing in relation to recent years.
Big Ten EPA/play Comparison
EPA (Estimated Points Added) is the best existing metric for conveying a play’s value. I explain a bit in the Gameday Roundup how it works, and in the below graph, each Big Ten team’s EPA is split between offense and defense to show which teams are statistically better in each phase.
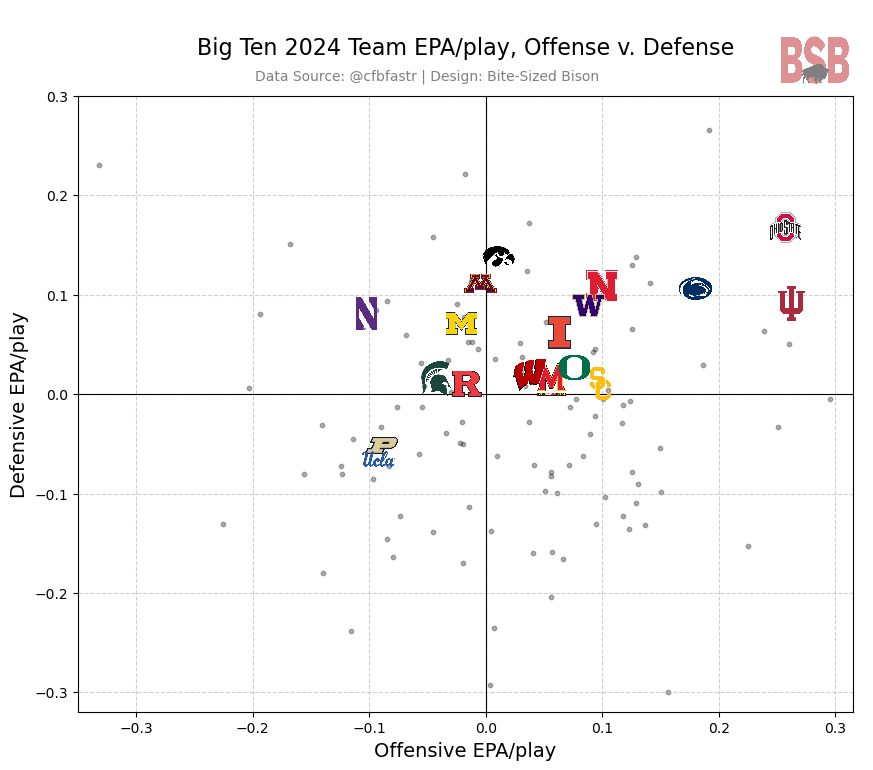
Observations:
I added other FBS teams as dots to provide further relation outside of the Big Ten.
This view shows the quality of Indiana’s defense, which had been sliding down the Big Ten rankings recently. Not to mention the dominance of Indiana’s offense.
UCLA refuses to thwart allegations of being a bad football team.
I said it last week, but Nebraska and Washington are interesting analytical matchup sin the coming two weeks. There’s a real chance their statistical profiles don’t convey their inconsistencies, but what’s undeniable is that they present challenges Indiana has only really seen from Maryland.
Big Ten QB Comparison
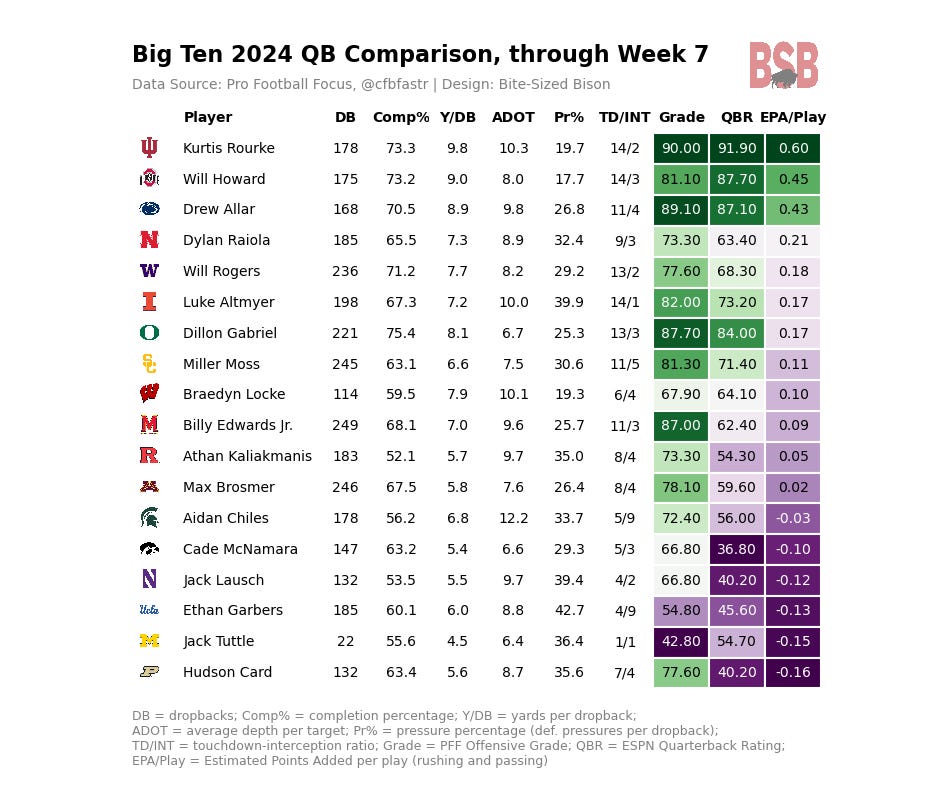
Observations:
Kurtis Rourke is making most of the conference look silly (see the purple in relation to his EPA/play), and that’s within a conference that has seen a massive improvement in QB play in general.
Something that hasn’t been noted often is that Rourke is 2nd in the conference in average depth of target. With the accompanying 2nd-best completion percentage, he is simply gouging opposing defenses through the air.
For a true freshman, Dylan Raiola has been impressive. It hasn’t been perfect, especially since he’s pressured at a 32.4% rate, but he’s ranked 4th in the Big Ten in EPA/play. He’s also the playmaker Indiana needs to dampen the most.
Cade McNamara threw his first TD against a Power 4/5 opponent since 2021 this weekend, but he’s tied with Aidan Chiles, with 5.
Indiana Pass-Catchers
Pro Football Focus ranked Indiana’s WR room as the best at the position after Week 6. The chart below shows various metrics for each pass-catcher in Indiana’s offense, sorted by total Win Probability Added to Indiana’s games.
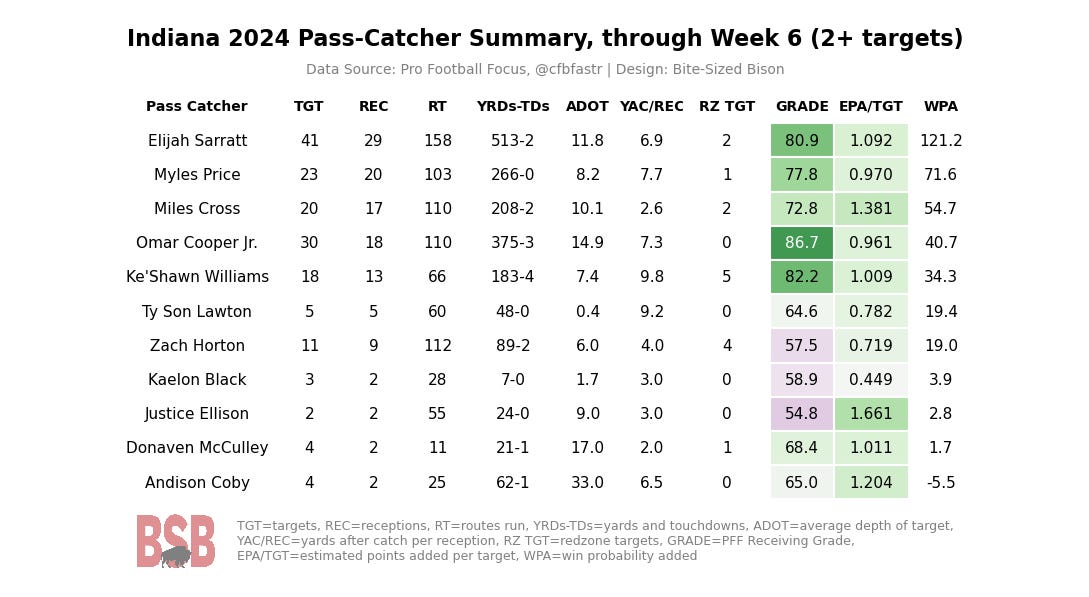
Observations:
Win Probability Added is a way to measure individual significance toward the outcomes of Indiana’s games. In this regard, Elijah Sarratt is, by quite a margin, the most influential pass-catcher on the offense. Myles Price and Ty Son Lawton ranked higher than I anticipated though.
The collective YAC in this group is not normal in the FBS. Just within the Big Ten, Indiana ranks 4 WRs in the top-14.
Ke’Shawn Williams leads the team in red zone targets, just ahead of Zach Horton. This is an area to watch, after the big-bodied Donaven McCulley entered the portal.
Zach Horton has run more routes (112) than all but Sarratt, but he’s only been targeted 11 times. This is undoubtedly a tool the offense will use in certain scenarios, even if it hasn’t yielded much yet.
Andison Coby’s average depth of target (33.0) is quite insane.
The chart below conveys each Big Ten WR’s EPA/target, which is not entirely a reflection of the receiver but more of a way to show the value of the plays when each receiver is targeted. This way, rather than accounting for a pass-catcher’s individual performance alone, it also accounts for offensive scheme and execution when that player is involved, creating an assessment of the offense’s success rather than simply the player’s.
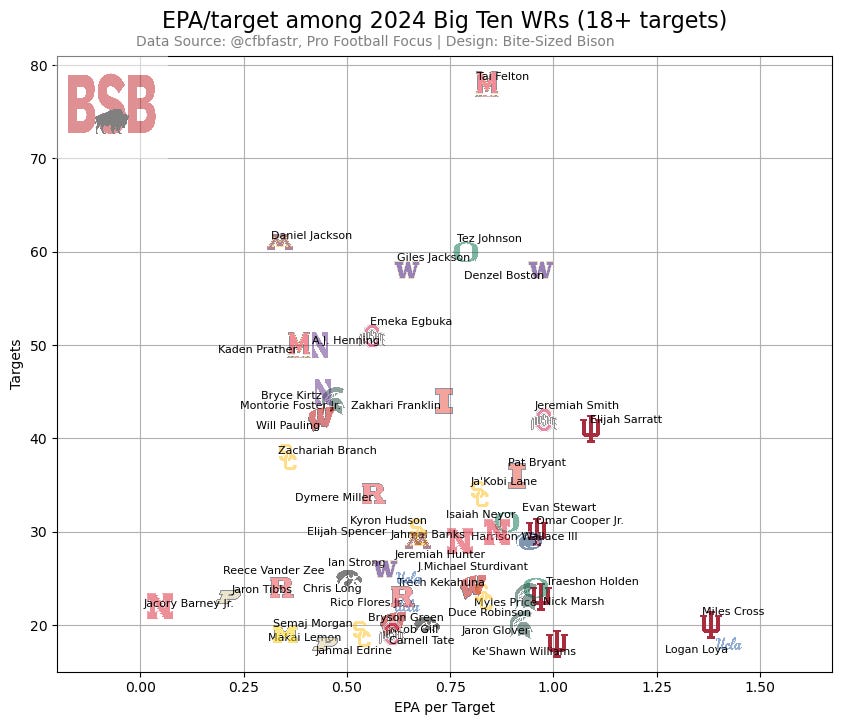
Observations:
UCLA’s Logan Loya has surpassed Miles Cross in EPA/target, as he just creeped into qualifying targets. That won’t last long.
Indiana still has 5 WRs in the top-10 of the Big Ten in EPA/target.
Nebraska’s Isaiah Neyor is the pass-catching threat to watch next weekend. He is 14th in the conference in EPA/target (just ahead of Maryland’s Tai Felton and Oregon’s Evan Stewart), and he’s 5th in the conference in yards per reception (17.1).
Nebraska’s Jacory Barney is an interesting WR. He’s graded as the 7th-best WR in the conference by PFF, but plays that target him are among the least valuable, largely due to his 3.8 average air yards per target.
Indiana has a couple high-value WRs on Washington’s offense coming up in a couple weeks too.
Defensive Line Havoc
With this JMU staff coming to Indiana, there is going to be a major philosophical change on defense, charging the DL with creating havoc rather than just the LBs. The Hoosiers ranked second-to-last in DL havoc rate in 2023. Havoc is defined in different ways in different places, but I chose to include plays that involved QB hurries, QB hits, sacks, TFLs, forced/recovered fumbles, batted/deflected passes, and interceptions – basically any time a DL is negatively impacting the offense. The benefit of the below chart is that it disaggregates the different havoc plays to show not just the total number of havoc plays but also how that havoc is achieved. The chart is then sorted by havoc rate (the percentage of defensive plays that feature DL havoc).
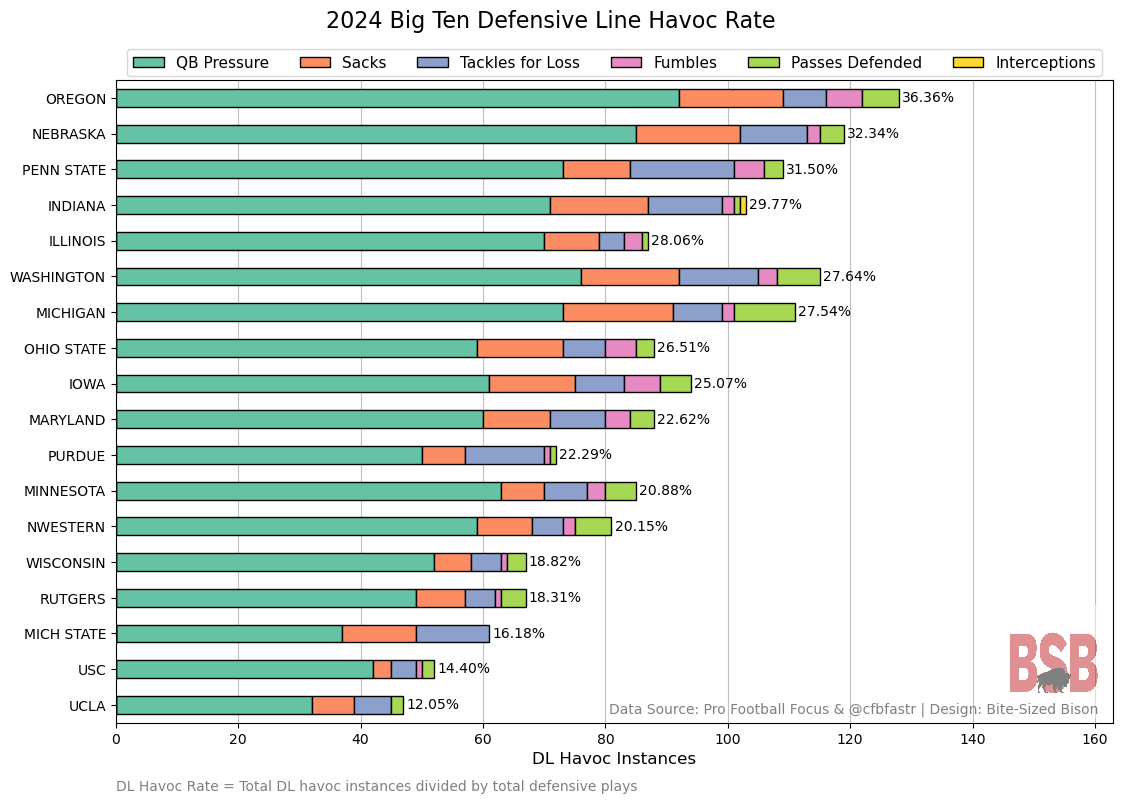
Observations:
Nebraska represents the first opponent this season that actually produces more havoc from its DL than Indiana. This will be a major test for the Indiana OL that recently took charge of the top Big Ten average PFF grade on the OL.
The good news for Indiana is that outside of the DL, Nebraska doesn’t cause much more havoc.
Indiana’s defense has analytically been good, but I’d personally like to see this metric improve from them. Sixth in the conference in DL havoc instances is likely not what Bryant Haines and company were hoping for when they brought their DL chaos system to Bloomington.
Again, looking ahead, Washington causes quite a bit of DL havoc, but even with such a high total, the rate is 6th in the conference, signaling plenty of havoc coming from other areas of the defense.
The trenches were not friendly to Ohio State this weekend. Oregon demolished the OSU OL for most of the game, and it shows here. Ohio State forced so little havoc from its DL that is tumbled from 1st to 8th on this list in one week.
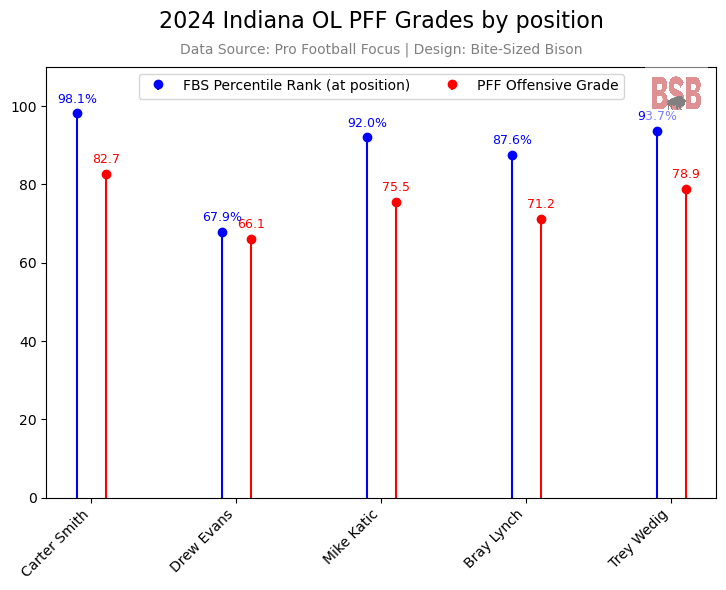
Offensive Line Production
Assessing OL play is so subjective and (in many ways) unquantifiable, so I’ve chosen to lean on PFF grades. The below chart is simple – each Indiana OL’s season-long PFF Offensive Grade is listed next to the percentile he ranks within at his respective position (T, G, C) in the FBS.
After a micro look at OL production, I want to zoom out and compare to the rest of the Big Ten. The below chart filters all PFF OL grades to account for any OL that records at least 20% of the highest recorded blocking snaps and draws a line for each team from its minimum grade to its maximum. Each team’s logo is then placed at the average grade.
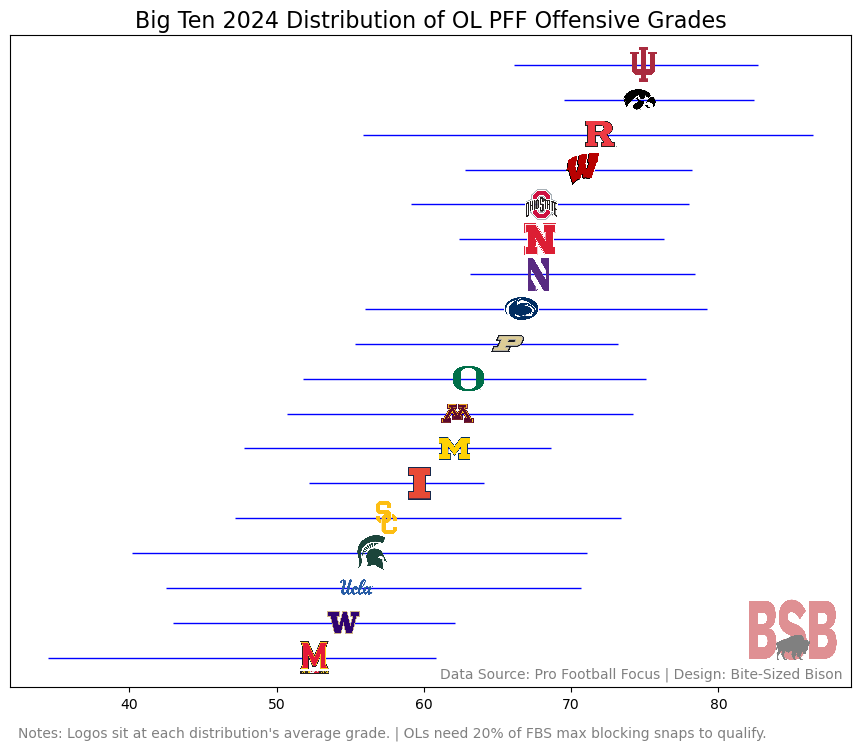
Observations:
Drew Evans’ blocking grade dropped a bit over the bye week, as they continue to reviews over time, but it didn’t help the Hoosiers much here. His grade will define the floor of this unit, and so far, he’s been solid.
It was noted earlier, but the trenches are going to be where Indiana will need to execute against Nebraska this week. The Huskers are ranked 6th on this chart and have been there pretty consistently.
All of the encouraging progress that IU is making is undoubtedly great. I worry about bad bounces or a few bad decisions that could go against IU. Upcoming games will leave little room for error.
Getting past the normal IU fan fears and phobias, this defense seems designed to play in space against spread teams with speed and mobility. Much like CTA’s was but the DL is set up more in attack mode. With the meatier part of the schedule upcoming, power run teams may prove more of a challenge. TO ME IU has a smaller defensive front and may be vulnerable inside. IU relies a lot on slants and stunts. It seems that you could simply push the IU defender in the direction he wants to go and look for cutback lanes.
For me IU’s area for most improvement is penalties.