

Week 11 Recap: Michigan
Now that the dust has settled, let's take a deeper look at Indiana's matchup against Michigan.

Programming Note: There will be a bonus BSB Recap later this week breaking down this weekend’s game in a much deeper way. For now, please enjoy these in-depth metrics below!
Indiana exorcised some demons as a program on Saturday, in its defeat of Michigan, 20-15. For what was a close game, Indiana ended with a 96.5% postgame win expectancy, according to ESPN SP+, which means the Hoosiers left a lot on the field in unforced ways. Another example is shown below, which compares net success rates (via Parker Fleming):

First of all, yikes, Iowa! Second, Indiana’s game against Michigan was not nearly as close as the score leads us to believe. Getting out of there with a win was huge for the Hoosiers.
Now, Indiana stands with the second-highest odds to make the College Football Playoff (behind Oregon) and goes into the second bye week having slayed a middle portion of its schedule — Nebraska (45th in SP+), Washington (46th), Michigan State (83rd), and Michigan (40th) — with a scoring margin of 154-49.
[Prepare for Tuesday’s updated CFB rankings with last week’s BSB]
Inside this BSB weekly recap:
Offense and Defense Snap Counts and PFF Grades
Indiana Cumulative EPA Tracker, Offense and Defense
Big Ten EPA/play Comparison
Big Ten QB Comparison Chart
Big Ten WR EPA/target Chart & Indiana Pass-Catcher Comparison Chart
Big Ten DL Havoc Chart
Indiana OL Production & Big Ten OL PFF Grades Distribution
If you missed the Bite-Sized Bison Gameday Roundup after the game, it discusses scenario-based EPA, cumulative EPA, and win probability, as well as more traditional stats and their respective top performers for each team. You can find it at the button below.
Indiana Offensive Snap Counts & Grades
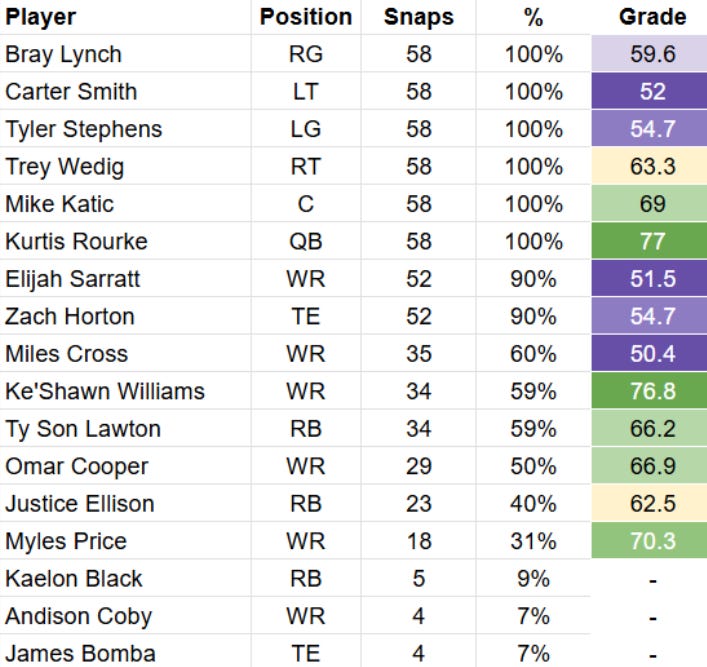
Observations:
Carter Smith struggled more than any Indiana OL in pass protection, as he surrendered 4 of his season-long 9 QB pressures against Michigan. Smith and Trey Wedig are now 8th and 10th in QB pressures allowed, among Big Ten tackles.
Tyler Stephens stepped in for the injured Drew Evans, and while his grade isn’t impressive, the numbers suggest he did a decent job. He allowed just one QB pressure (second to Mike Katic’s 0), and Indiana ran half of its rushing plays toward either shoulder of Stephens and found most of its success there. It averaged 3.8 yards per carry and converted 4 of its 5 rushing first downs in that direction.
Elijah Sarratt had an uncharacteristic performance Saturday. He was targeted 5 times and caught just one of those passes, though it was for a touchdown. He had two brutal drops in clutch situations.
Ke’Shawn Williams has been targeted once every 5.2 snaps he’s played in the last two weeks.
Ty Son Lawton ran hard Saturday, and the staff rewarded him for it.
Indiana Defensive Snap Counts & Grades

Observations:
Michigan’s offense is not good, but it is filled with talent, which its defense showed can make up for statistical shortcomings. Yet, Indiana’s defense stacked very favorable grades across the board.
Indiana only played with a Rover on the field for 52% of its defensive snaps, as it sought to keep Michigan’s running game in check. Terry Jones played extremely well during those snaps too.
Something that was key to Indiana’s defensive success was keeping Aiden Fisher and Jailin Walker in optimal positions to make plays. Fisher logged his second-best grade of the season (via PFF), and Walker recorded his best. 10 of Michigan’s plays were upended due to singular efforts by either Fisher or Walker, they combined for 21 tackles, and neither allowed a catch for longer than 9 yards. It’s tough to ask for anything more from an LB duo.
James Carpenter has logged his best grades in the last four games and now ranks 9th in the conference among DTs in snaps played. He will be crucial in the final stretch of the season.
Michigan wanted nothing to do with D’Angelo Ponds. His coverages were targeted just once. But Jamier Johnson was targeted heavily (5 times before his ejection for targeting). He surrendered a 105.8 passer rating. Jamari Sharpe filled in for Johnson and played very well, allowing just a 47.9 passer rating and just 12 yards on 5 targets.
Watch for Lanell Carr as the season finishes. Along with most of Indiana’s DL, he’s logging his best games of the season now too. His performance against Michigan was his best (4 QB pressures and 3 individual stops), and he’s forced 9 QB pressures in the last two games.
Indiana Cumulative EPA Comparison, Offense and Defense
Indiana was a drastically different team in any of the five seasons between 2019 and 2023, and 2024 is expected to be even more so. Comparing 2024 offensive and defensive cumulative EPA to the previous five seasons can offer some insight into how the season is progressing in relation to recent years.
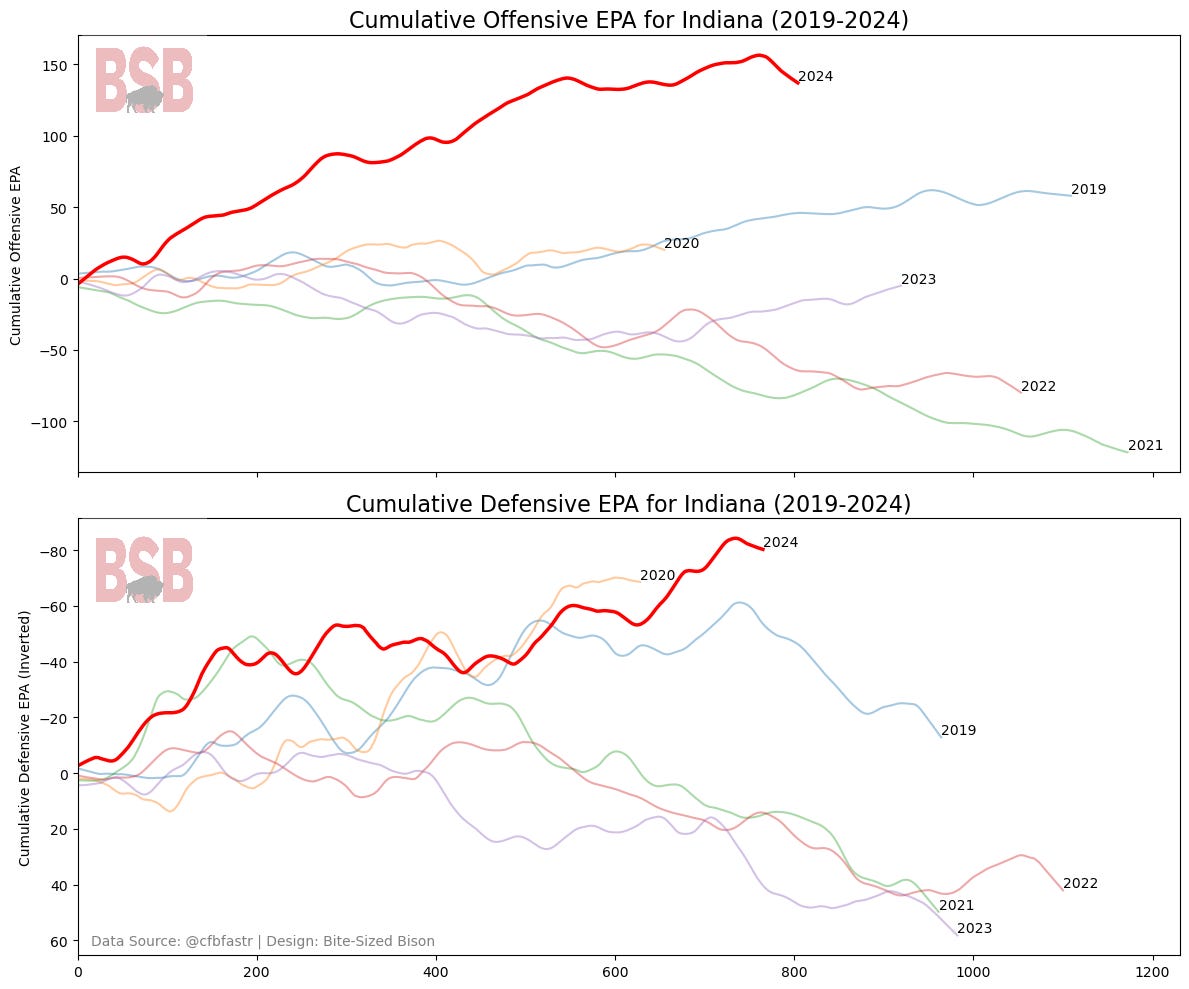
Observations:
This is the first game of the season where Indiana surrendered ground to a single opponent on both sides of the ball, in terms of cumulative EPA.
Big Ten EPA/play Comparison
EPA (Estimated Points Added) is the best existing metric for conveying a play’s value. I explain a bit in the Gameday Roundup how it works, and in the below graph, each Big Ten team’s EPA is split between offense and defense to show which teams are statistically better in each phase.
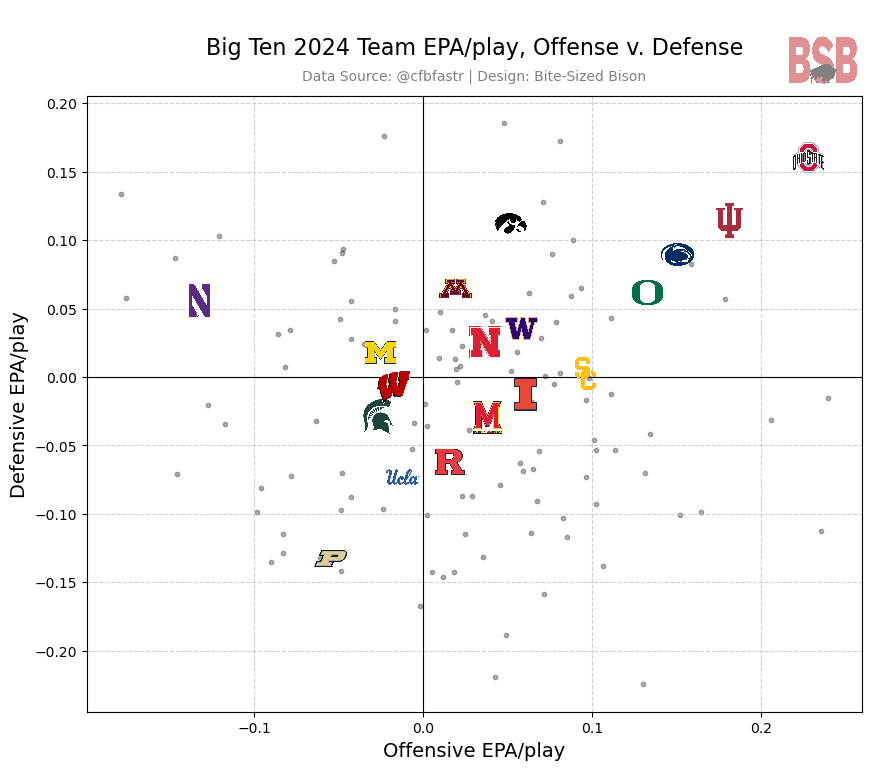
Observations:
As Indiana’s DL continues growing into itself, the defense is proving to be one of the most productive in the FBS, unadjusted for opponents.
Few teams have played as effective complementary football as Indiana so far. Ohio State will be the second opponent (after Washington) to also play effective complementary football, and it happens to do so at the highest level in the nation.
Big Ten QB Comparison

Observations:
Kurtis Rourke was pressured more in this game than in any other in 2024. Michigan recorded 10 QB pressures. The previous high was 9 against Washington. I won’t paint this as some sort of victory, because it’s not, but Michigan averaged 20.1 QB pressures per game against Power 4 opponents — including 18 on Oregon, 17 on Illinois, 26 on Minnesota, 27 on USC, and 13 on Texas. What hurt Indiana the most is that 4 of those 10 pressures resulted in sacks. Michigan averages 2.5 sacks per game this season.
What can only be determined by the eye test is that Rourke was uncomfortable in ways we hadn’t seen yet this season, and that is reflected in his dip from 0.55 EPA/play to 0.43. However, he still recorded a 70.4% adjusted completion percentage, which was 7th among Big Ten QBs in Week 11, and the 2nd-best offensive grade under pressure by a long shot — 15.4 points above the 3rd-best and 1 point behind 1st-place Will Howard.
Big Ten Pass-Catcher EPA/target
The chart below conveys each Big Ten WR’s EPA/target, which is not entirely a reflection of the receiver but more of a way to show the value of the plays when each receiver is targeted. This way, rather than accounting for a pass-catcher’s individual performance alone, it also accounts for offensive scheme and execution when that player is involved, creating an assessment of the offense’s success rather than simply the player’s.
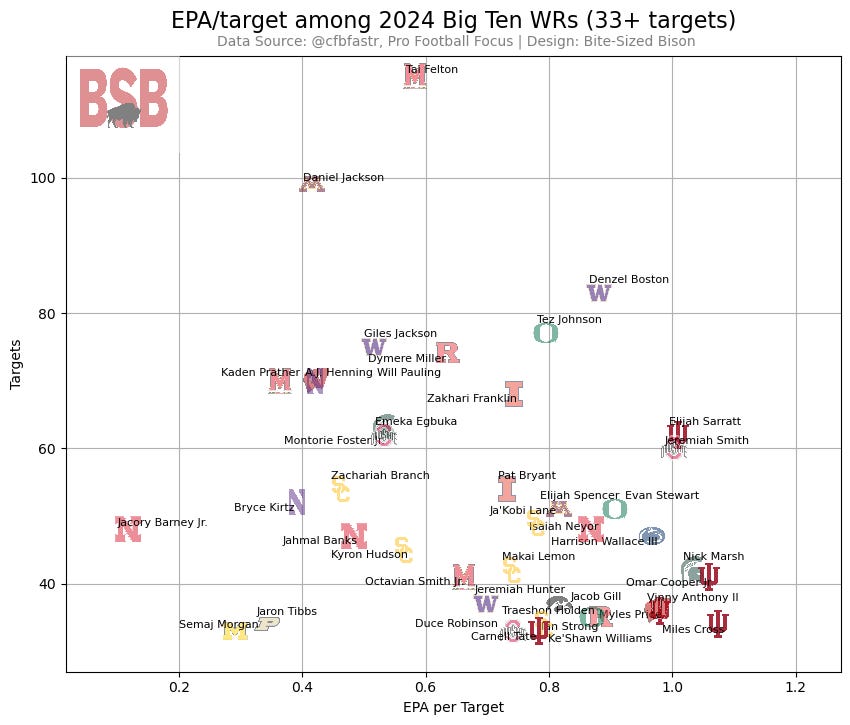
Observations:
Ke’Shawn Williams might not be as high as some other WRs on this chart, but he’s currently inching out Ohio State freshman WR Jeremiah Smith with the highest PFF Offensive Grade of anyone o this chart.
Omar Cooper is the 5th-highest graded WR in the Big Ten and stands head and shoulders above the rest (4th nationally) in yards per catch, with 22.0. He is averaging 21.3 yards per catch during Big Ten play, and in his last four games (since Nebraska), he’s averaging 30.4 (!!) yards per reception. He is 28th in the Big Ten in targets and seemingly has deserved more looks, but at the same time, the explosive plays designed for him require a lot of setup by the offense. This is why his 0 drops this season feel so big 11 weeks into the schedule.
Miles Cross has essentially been a non-factor in the passing game during the last three games, as he’s brought in just 1 of his 7 targets for 16 yards. Four of those targets were contested (0 caught). His absence has been felt too, as Indiana has looked to Ke’Shawn Williams and even the RBs more often during those last three games.
Elijah Sarratt is now tied for 4th among WRs on this chart in drops, with 4. Only Miles Cross (1) and Myles Price (1) have drops among the other IU WRs. This is new for Sarratt. He was targeted 155 times during his first two collegiate seasons and dropped 2 passes (1.3% drop rate). Now he has 4 drops in 62 targets (6.5% drop rate). PFF considers on-target passes within its drop rate calculations, and Sarratt has dropped 9.5% of them. He’s also now roughly even with previous seasons’ contested targets (18) and has caught just 44.4% of them (78.9% in 2023, 61.1% in 2022).
Indiana Pass-Catchers
Pro Football Focus ranked Indiana’s WR room as the best at the position after Week 6. The chart below shows various metrics for each pass-catcher in Indiana’s offense, sorted by total Win Probability Added to Indiana’s games.

Observations:
Justice Ellison was targeted a career-high 5 times against Michigan, and he’s been targeted 8 times in the last two weeks, as Indiana diversifies its passing attack. It still hasn’t produced the most valuable results yet, though.
Indiana has targeted its RBs 13 times in its last three games. In the seven games previous, it targeted RBs just 14 times. While Indiana has completed 24-fo-28 RB targets, the Ty Son Lawton swing route from previous weeks really seems to be the only valuable play so far, as shown by EPA/target. This doesn’t mean they should get away from throwing to RBs, because the best offenses do involve their RBs in the passing game; it just means there is some unrealized value here.
Omar Cooper got his first redzone target of the season against Michigan and made it count.
Cooper and Ke’Shawn Williams are 3rd and 4th in the Big Ten (16th and 19th nationally) in YAC/reception among WRs (33+ targets).
Defensive Line Havoc
With this JMU staff coming to Indiana, there has been a major philosophical change on defense, charging the DL with creating havoc rather than just the LBs. The Hoosiers ranked second-to-last in DL havoc rate in 2023. Havoc is defined in different ways in different places, but I chose to include plays that involved QB hurries, QB hits, sacks, TFLs, forced/recovered fumbles, batted/deflected passes, and interceptions – basically any time a DL is negatively impacting the offense. The benefit of the below chart is that it disaggregates the different havoc plays to show not just the total number of havoc plays but also how that havoc is achieved. The chart is then sorted by DL havoc rate (the percentage of defensive plays that feature DL havoc).
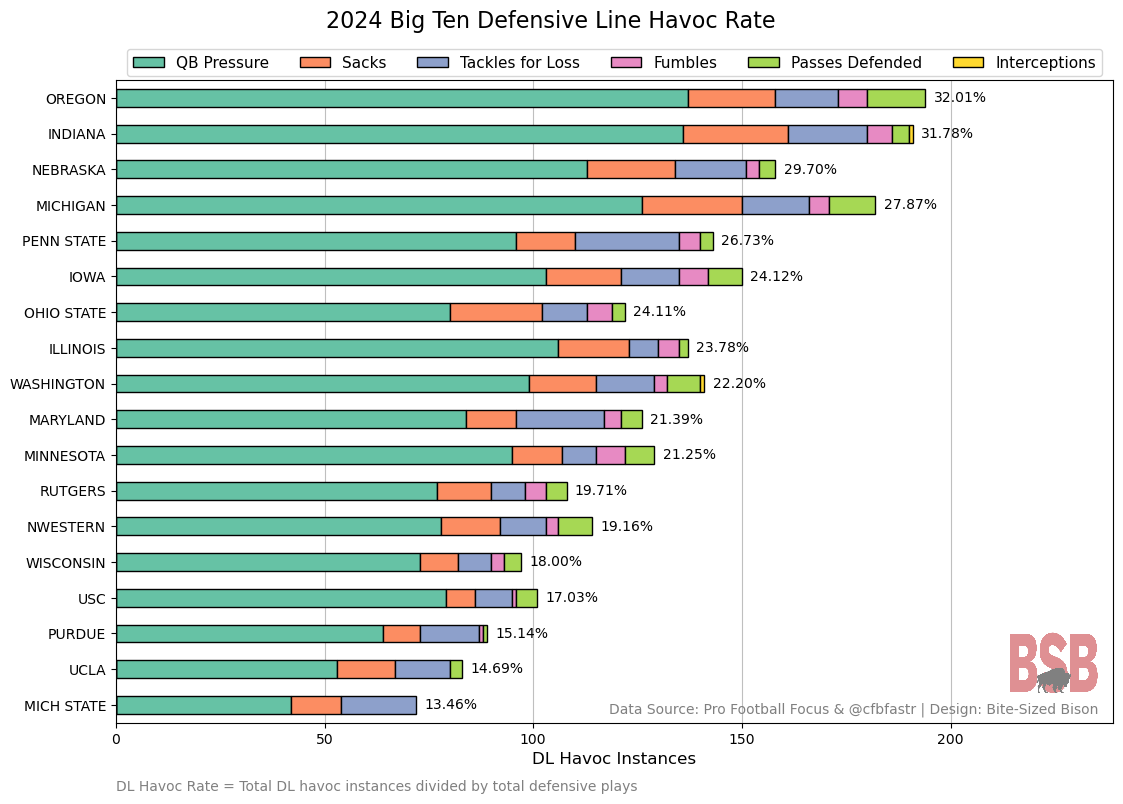
Observations:
The Michigan DL absolutely got on the Indiana offense. There is no questioning that (which I will write about later this week). However, Michigan came into this game ranked No. 1 in DL havoc instances (see the Preview) — including No. 1 in QB pressure — and now it’s ranked 3rd in both categories. That was the most talented and effective DL Indiana will see during the regular season (maybe all season), and, down its starting LG, Indiana managed to find enough offensive success to win. Not many teams get to learn that lesson and also walk away with a W.
I wrote in the Preview about the danger of Michigan DEs Josaiah Stewart and Derrick Moore (two of the best pass rushers in the Big Ten and FBS), and while Indiana’s OL didn’t have a great day, it only allowed 2 total QB pressures from those two. It was actually the third DE, TJ Guy, who caused the most damage on the edges, as he sacked Kurtis Rourke on both of his QB pressures.
Where Michigan hurt Indiana the most was in run defense, as Indiana allowed 8 TFLs (22% of its total this season, according to cfbstats.com). And between TFLs and sacks, Indiana lost 73 yards. When considering Indiana totaled just 40 rushing yards, that’s a major loss.
Looking ahead, Ohio State’s DL has struggled to find the havoc it once produced. There is, of course, still a talent gap — much like this past week — but the productivity isn’t there.
Offensive Line Production
Assessing OL play is so subjective and (in many ways) unquantifiable, so I’ve chosen to lean on PFF grades. The below chart is simple – each Indiana OL’s season-long PFF Offensive Grade is listed next to the percentile he ranks within at his respective position (T, G, C) in the FBS.
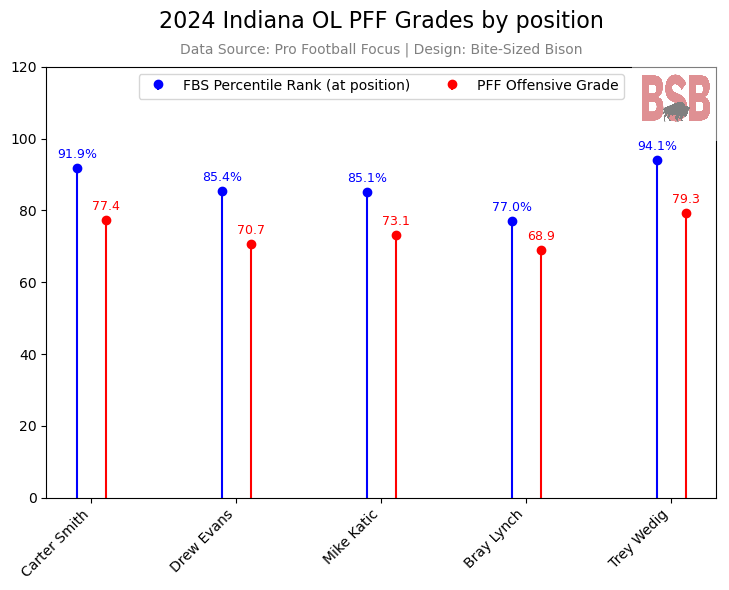
Note: Drew Evans remains on this chart because altering the qualifications to include Tyler Stephens would dilute insights into the other four OLs. Tyler Stephens’ PFF Offensive Grade is 51.6, which is in the 7th percentile of FBS guards with 100+ snaps in 2024.
After a micro look at OL production, I want to zoom out and compare to the rest of the Big Ten. The below chart filters all PFF OL grades to account for any OL that records at least 20% of the highest recorded blocking snaps and draws a line for each team from its minimum grade to its maximum. Each team’s logo is then placed at the average grade.

Note: Like the chart above, Tyler Stephens is not included in this chart, because expanded snap qualifications would really dilute any insights gained on the other programs. I’m working to find a way to adjust it to maintain relevance.
Observations:
Using the info on Tyler Stephens above, you can see that Indiana’s minimum grade would actually be roughly the 8th-lowest minimum in the conference.
However, even with Stephens’ grade included, Indiana’s average PFF grade for its starting five OLs is 70.1, which would be roughly below Wisconsin for 4th in the Big Ten.
Excellent observation about IU taking the middle of the field away. A big fear for me going in was their TE OUT MANNING IU’s linebackers across the middle and up the seem. That they had to flank him wide in retrospect was key. The announcers kept saying IU “was playing too far off” outside but it worked out. I have to remind myself sometimes that the goal isn’t shutting someone out but WINNING
I feel like Stephen played really well with the circumstances and have a lot of fair of coach Bolstad. With Kidwell and now Evans anymore O Linemen going down will really test the team’s depth. Does anyone else yell cooooop after Omar cooper makes a catch from their couch?